

Profit and Loss Just Crossed in a Bullish Way. This Is the Fourth Time.
· Technical Analysis · Stormrake
- BTC
- ZEC
Half the supply at a gain, half at a loss, and in 100% of the last three cycles - this confirmed the generational low was locked in
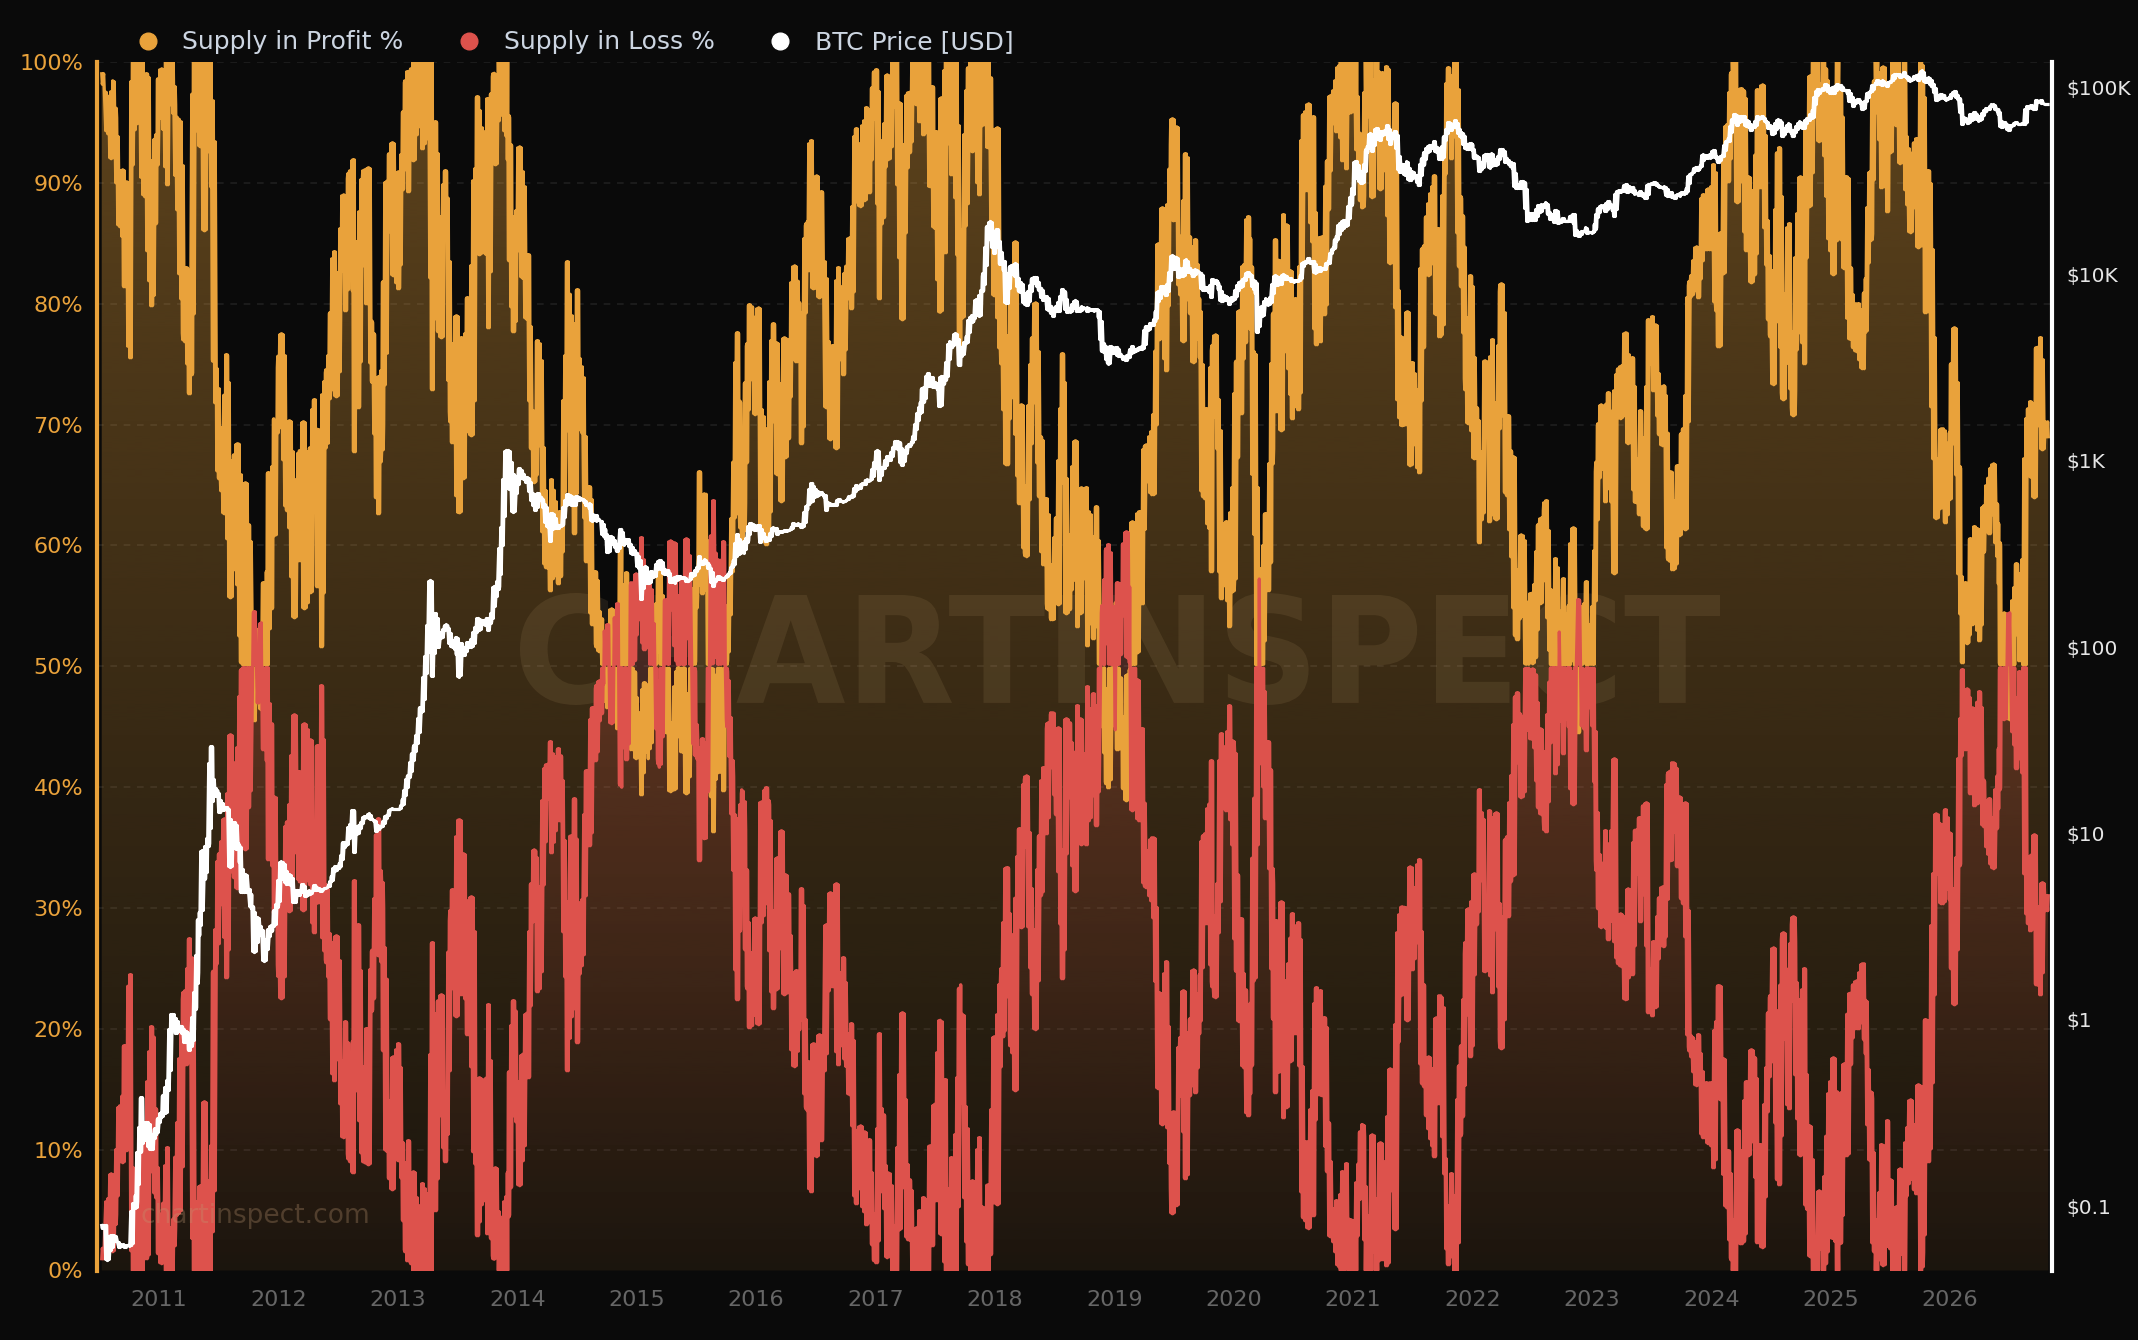
Every Bitcoin is held either at a gain or at a loss, measured against the price at which it last moved. When the share in profit and the share in loss meet at 50%, the market is evenly split.
That has happened over the last three definitive cycles, at least four times. In all four cases the meeting point sat at or near a cycle low.
Source: https://chartinspect.com/charts/profit-loss
What the Crossovers Looked Like
The crossings all took different shapes depending on how much Bitcoin had matured as an asset class at the time. In 2015, 2018 and again in 2022, the lines crossed several times over a stretch of weeks, and prices spent that time moving sideways. In mid-2026 the pattern repeated, with price ranging for weeks before the trend turned. March 2020 was the exception, a brief crossing that gave way almost immediately and in-turn acted as essentially a bear market double-bottom, due to the commencing Covid-19 lockdowns, before going on to create the monster rally that followed in the coming twelve months, seeing Bitcoin rally over 1,500% in rapid succession.
After the earlier crossovers, the share in profit climbed towards 100% as expansion built, reaching close to that level at the later cycle highs.
A similar climb is under way now. As of the start of October, 69.2% of supply was in profit and 30.8% in loss, up from about 50% in mid-2026.
At 69%, the share still sits well short of the near-100% readings seen at earlier cycle highs. This positions Bitcoin strongly in the coming months ahead for recent buyers if we see continued price expansion.
What the Headline Number Hides
Providers measure this differently. Excluding coins that have been dormant for more than ten years, CryptoQuant analyst Darkfost puts the share near 60% and says it has held around that level since August. He reads that as a market recovering broadly without any sign of overheating.
Long-dormant coins were bought at very low prices and lifted the headline figure. The direction of travel matches the chart, and the level is lower than 69% suggests.
The recovery is also incomplete in cost-basis terms. In late August, CryptoQuant data put about $617 billion of invested capital still at a loss.
This Week’s Selling
Recent selling has picked up as more coins return to profit. Santiment recorded about $1.03 billion of realised profit in a single day, the second highest of 2026, and liquidations reached roughly $1.16 billion as Bitcoin slipped about 7% over the week.
More supply in profit gives more holders the option to sell at a gain, so a pullback of this kind sits comfortably with the metric. It also fits the record on how red weeks behave in our recent Q4 2026 Market Outlook: The Recovery Nobody Believes.
What We Are Watching
We are tracking four key items. The first is the share of supply in profit, where a return to the 50% line would put our reading in question. The second is continued selling below $80K (if it comes), since multiple closes back below would mean more time to accumulate. The third is the short-term holder cost basis, around $71,200, where a sustained loss would mean recent buyers are underwater in aggregate, although given this is below the $75K current trend support made during September, seeing anything below becomes far less likely. The fourth is the 27 to 28 October FOMC, where markets still price no change at roughly 73% to 76% depending on the source, even after a September CPI print of 3.7% year on year, above expectations, briefly lifted hike odds towards 50%.
Stormrake Spotlight: Zcash (ZEC) ($1,235)
Source: https://www.tradingview.com/x/VsnyTIdR/
Zcash (ZEC) has been one of the standout large caps of 2026. The privacy coin reached an eight-year high in August, helped by the launch of Grayscale’s spot Zcash ETF (ZCSH) on 25 August, which gave US investors a regulated route to the token. ZEC crossed $1,000 on 4 September, and ZCSH’s assets passed $1 billion on 24 September.
That rally has since reversed. ZEC peaked near $1,698 on 26 September, its highest level since 2016, and has pulled back roughly 27% since. ETF flows turned with it, with ZCSH recording $93.6 million of net outflows in the week to 2 October, its first outflow week since late August, and further redemptions since. Leverage magnified the move both ways, with short liquidations on the way up and long liquidations as price rolled over.
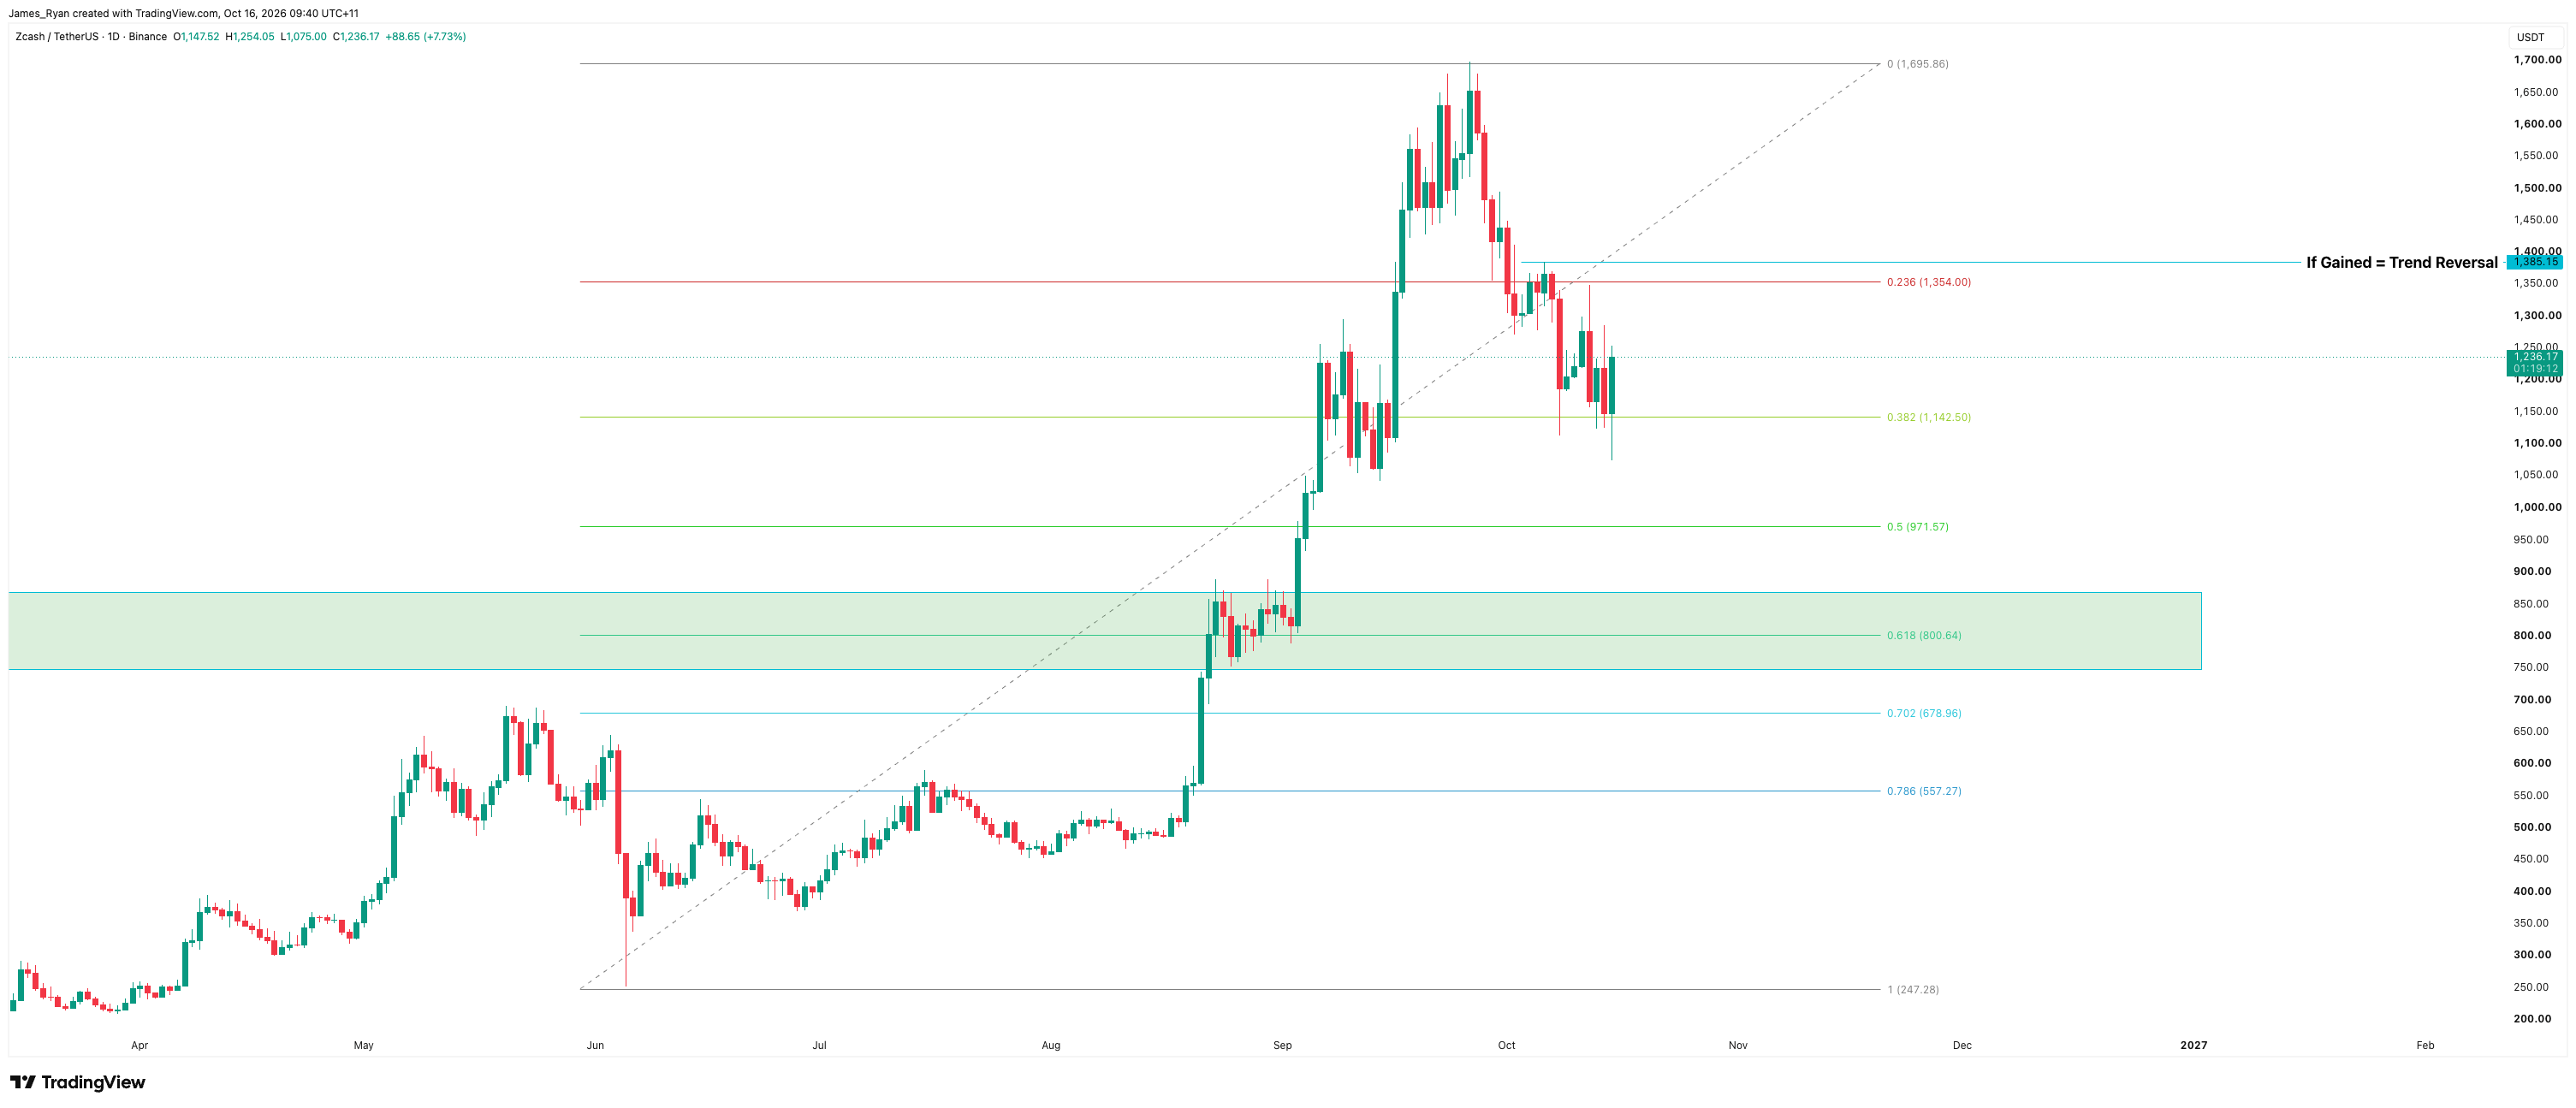
The structure in the short-term is bearish. Since the peak, ZEC has made localised lower highs, from $1,385 on 06 October, followed by a lower low, closing at $1,185 on 08 October, day that closed down about 10%. The bounces since have been hesitant. Today’s rally, assisted by a strong bounce in Bitcoin and across all major alts has helped, being up 14.96% since the quick liquidation wick down to $1,075 overnight. Price sits healthily at the 0.382% Fibonacci retracement zone currently, although will need to gain above $1,385 with another convincing, high momentum move in order to reverse local trend back in favour of the bulls.
The major overall trend support is $784 - $868 for this entire 2026 impulse move. This would only hit if we see more significant headwinds hit the asset, driven by largely bearish narratives and another major liquidation event would be required in order to see these prices. This level’s significance comes from the 0.618% Fibonacci retracement zone: a strong psychological reversal area where buyers see value in buying discounted assets. This zone also serves as a retest of the late-2025 cycle peak, from which we broke out of early September this year.
BTC/USD Key Levels and Price Action:
Source: https://www.tradingview.com/x/vuPzIJFJ/
Today’s Bitcoin Technical analysis is going to be simplified on purpose as over analysis will lead to paralysis in this space.
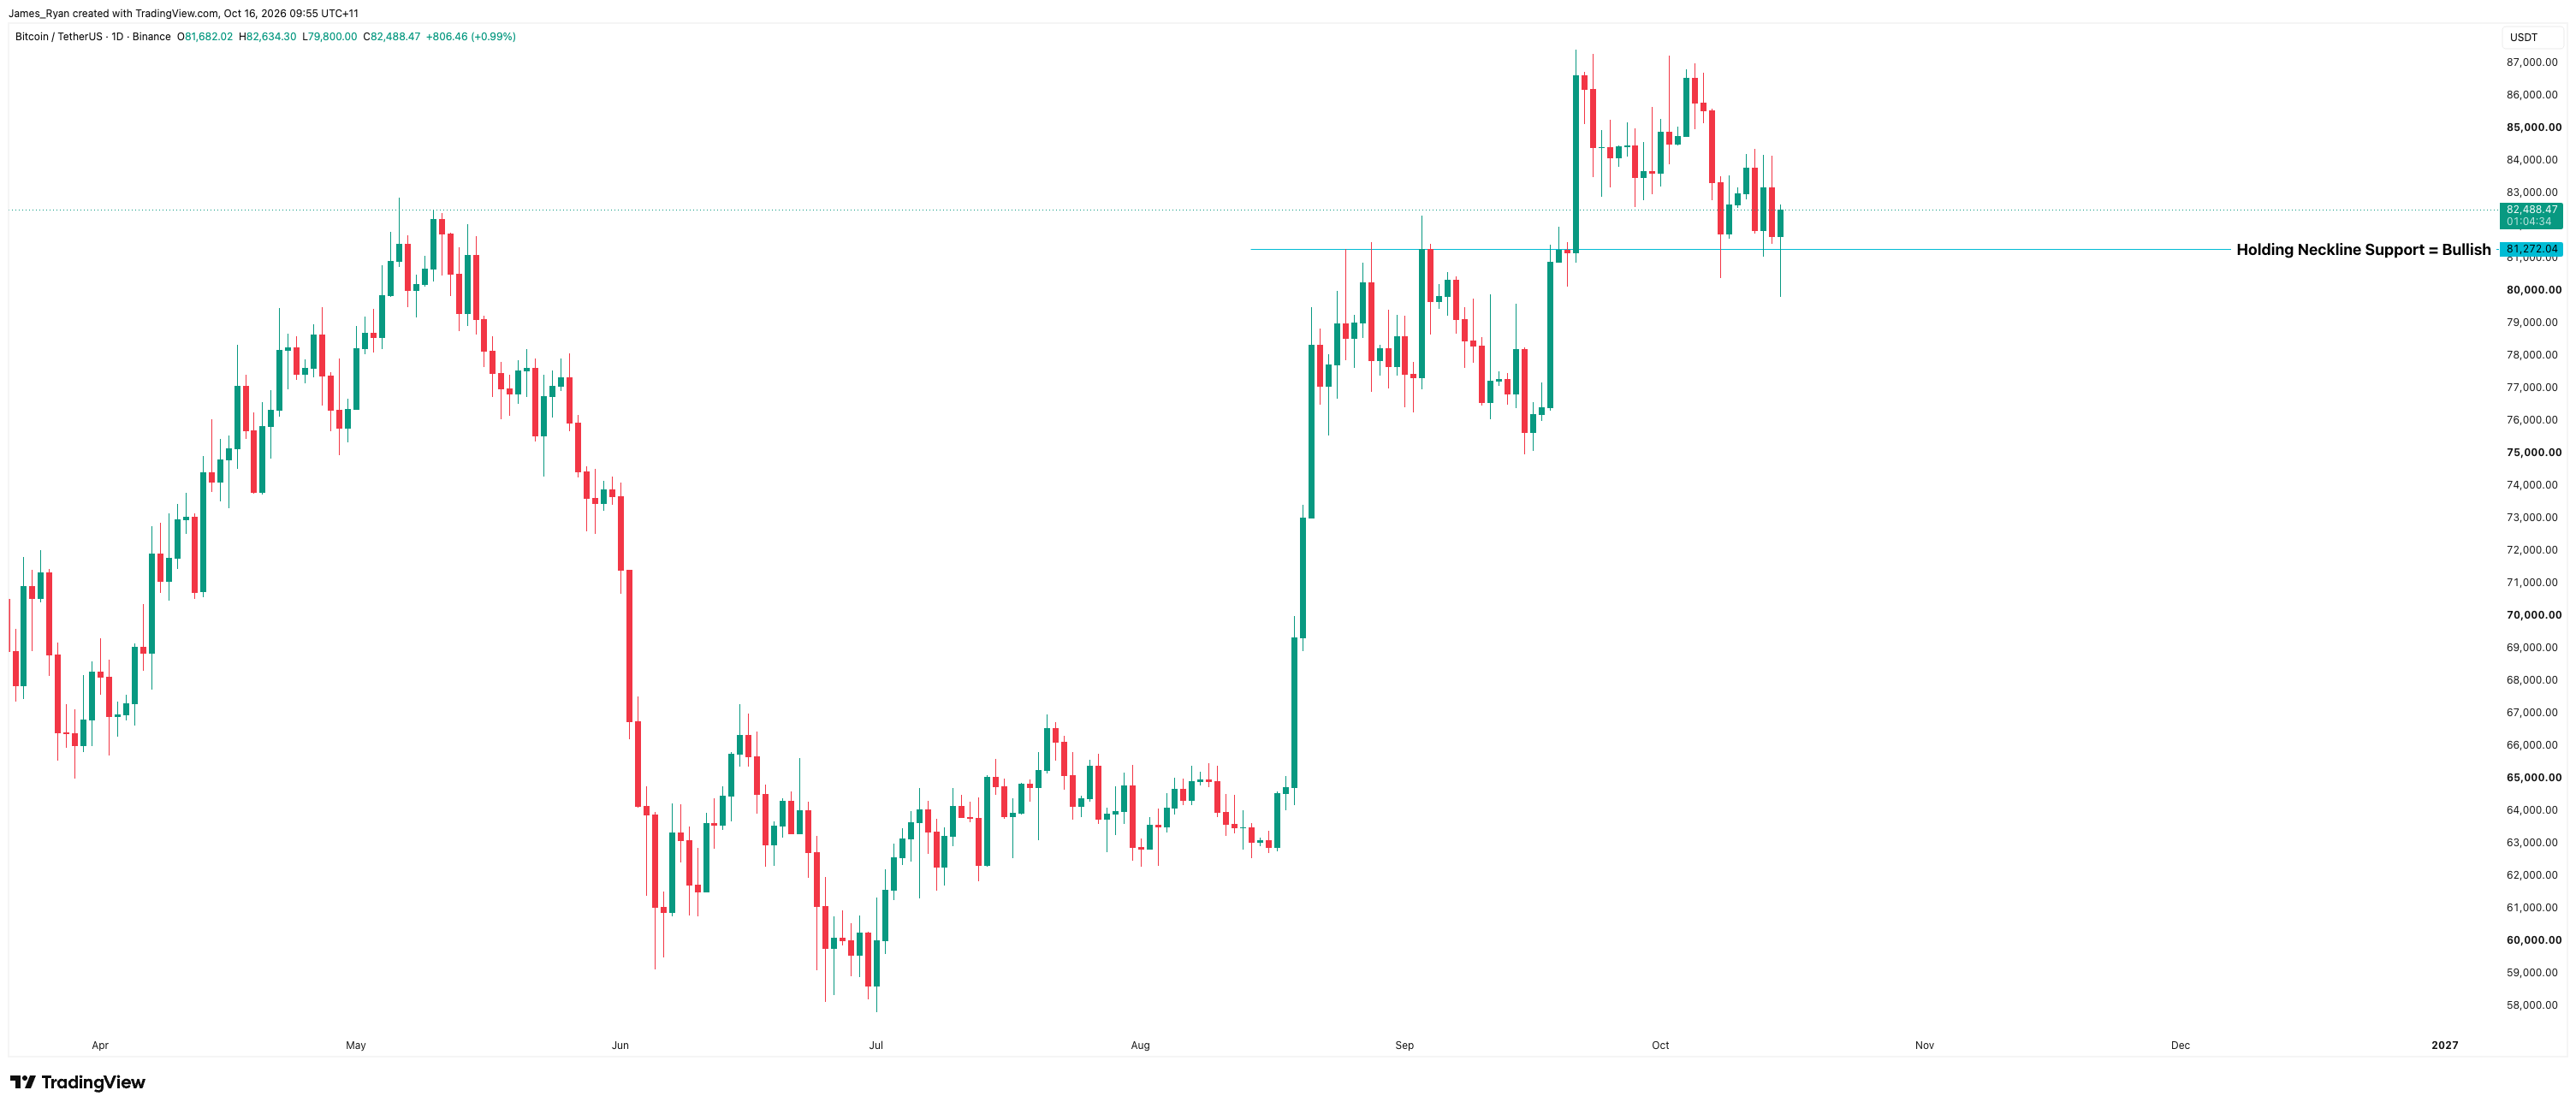
Despite Bitcoin pulling back yesterday and overnight to a wick low of $79,800, BTC has rallied back up over 3.36% in the early hours of this morning, comfortably resting above $82.4K once again. As we’ve mentioned previously, the neckline support of the 6-month long Inverse Head & Shoulders is going to provide major support for Bitcoin, and it’s held once again today. As long as Bitcoin continues to hold the line at this level, and bears fail to get continued closes below day-to-day, then the trend remains bullish.
This is similar to what happened to Bitcoin between July & August this year - where intra-day dips saw Bitcoin go down to approx. $62K, but the bears never could materialise a close below. After 3 - 4 failed attempts, Bitcoin blew everyone away by doing a +25% move in just 4 days. The more the bears fail here, the more bullish Bitcoin becomes - this insight will be key to understanding price-action as we go into 2027.
*All prices are denominated in USD unless stated otherwise*
Written by James Ryan
Disclaimer
This information is general in nature and does not take into account your personal objectives, financial situation, or needs. Before acting, you should consider whether this information is appropriate for your circumstances and seek independent advice if necessary.
Digital assets are volatile and carry significant risk. Past performance is not indicative of future results. You may lose some or all of your investment.