

Q4 2026 Outlook Breakdown - Part 5: What Red Weeks and the Ten Best Days Show
· Bitcoin Deep Dive · Stormrake
- BTC
- LIT
Recoveries meet red weeks along the way, and this quarter’s calendar offers a few candidates. Since the Q3 breakout we have treated the bear market as finished.
The statistics below describe how bull markets have behaved.
Pullbacks arrive inside every bull market, and each one raises the same question: has the cycle turned? We looked at what the three prior Bitcoin bull markets (2015 to 2017, 2020 to 2021 and 2023 to 2025) actually did after red weeks.
What Followed Red Weeks
Across the three cycles combined, the share of green weeks that followed rose as red weeks stacked up.
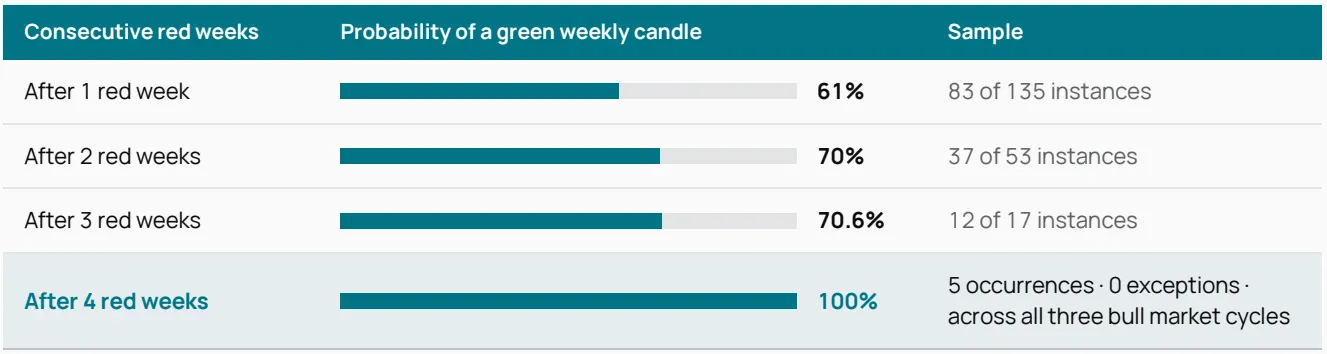
The monthly record points the same way. After two consecutive red months in a confirmed bull market, the next month was green in 5 of 6 cases (83.33%). Three consecutive red months have occurred once on record, and the next month was green. A single occurrence is too few to call a pattern.
The samples shrink as the streaks lengthen, which is why we quote the counts. These figures describe how earlier bull markets behaved and carry no prediction for the next one.
The result held across a retail-driven 2017, a liquidity-flooded 2020 and an institutionally anchored 2023. In each, longer red streaks were followed by green weeks more often, which fits with selling pressure running out within those cycles.
What a Few Days Do to a Year
A pullback also raises a second question: what happens to a year’s return if you are absent on its best days. The record on that is stark.
2024 returned +121% in full and would have returned -4.1% without its ten best days. 2025 printed a new all-time high of $126,272 in October, yet the calendar year closed at -6.3%. Without its ten best days it would have closed at -48.0%.
In four of the six years tested since 2019 (2022 excluded as a bear market year), an investor who missed the ten best days would have finished the year down: 2019, 2021, 2024 and 2025. These figures use log returns on the daily closes.
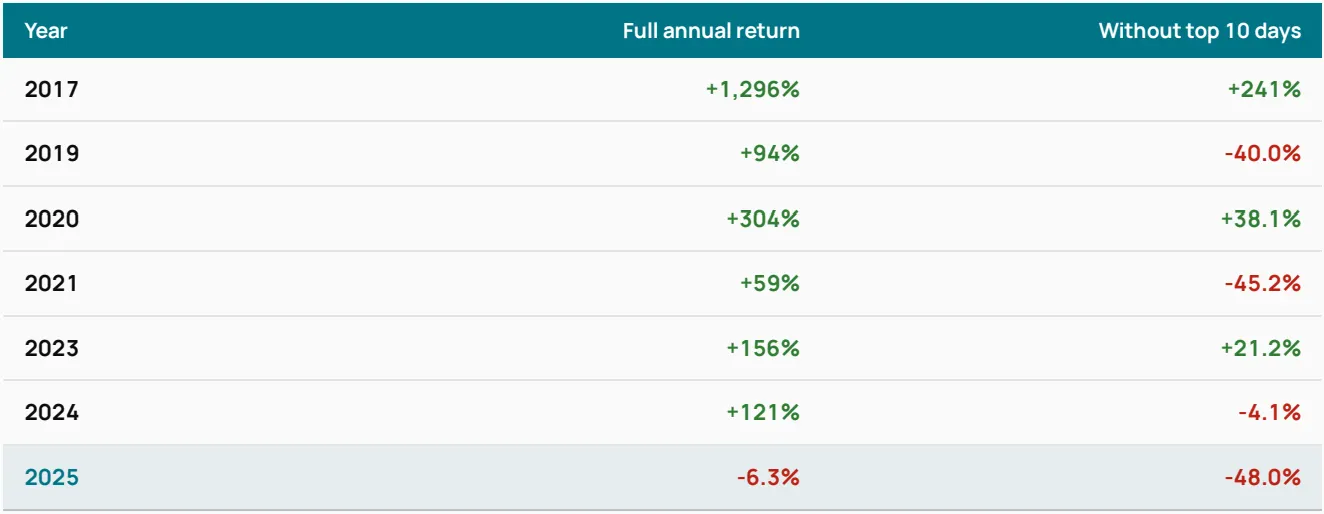
Those days arrive without notice, and the figures above measure what their absence cost.
What We Are Watching
Two scheduled events could produce pullbacks this quarter. We offer the record above as context for those weeks, and it carries no forecast of them.
These are the items we are tracking, and they carry no trading instruction.
We track the levels above through the quarter in these notes. The analysis behind them is in our Q4 Outlook, The Recovery Nobody Believes.
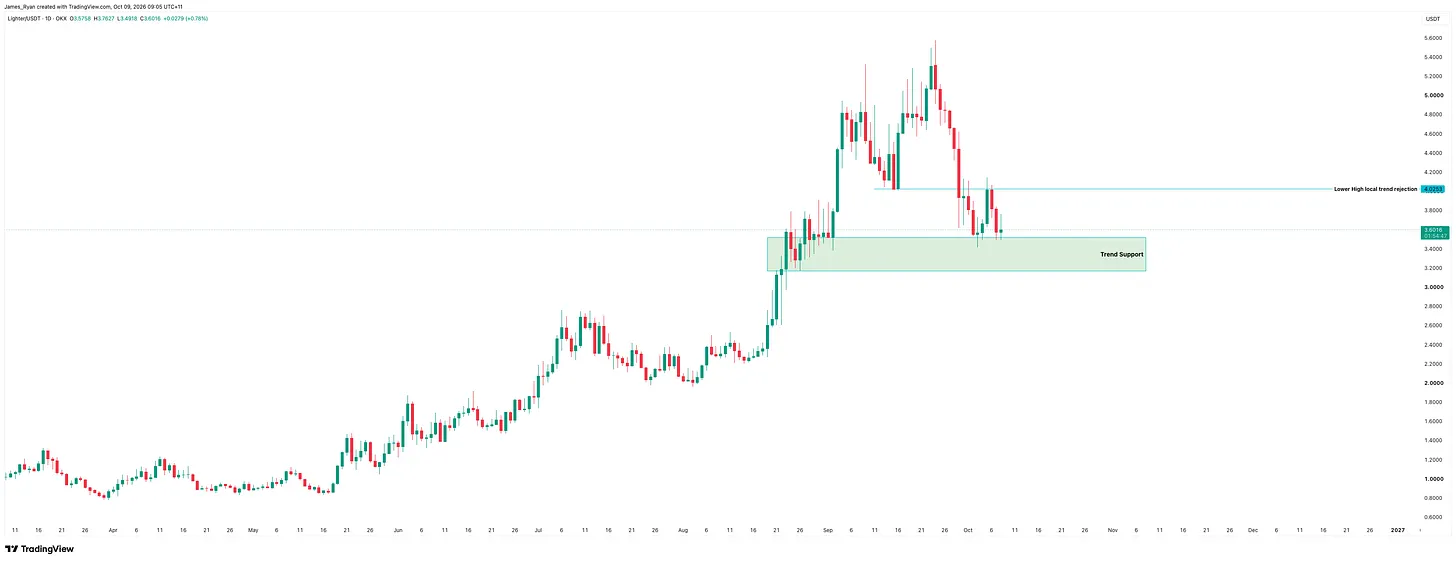
Stormrake Spotlight: Lighter (LIT) ($3.60)
Source: https://www.tradingview.com/x/fTAvB45J/
LIT holds at the trend support, primarily derived from the local cluster from late September where the coin coiled up to it’s peak. However, it’s worth noting a rejection and potential lower high forming at the $4.02 trend resistance where it’s begun to lose trend, now failing to gain back above that level with a retracement of the move up over the last week. If bears retain control here, a deeper push into the support zone and possibly more volatility in another slide beneath may come. This is the type of volatility that is common in alt coins, given they rally in brief, sharp and volatile spurts - only to then find they then spend 80% of their time or more re-accumulating in a downwards / sideways trend once again before being ready to go again. Regaining trend above the $4.02 level would need to come first before bulls looks at a prolonged trend reversal again.
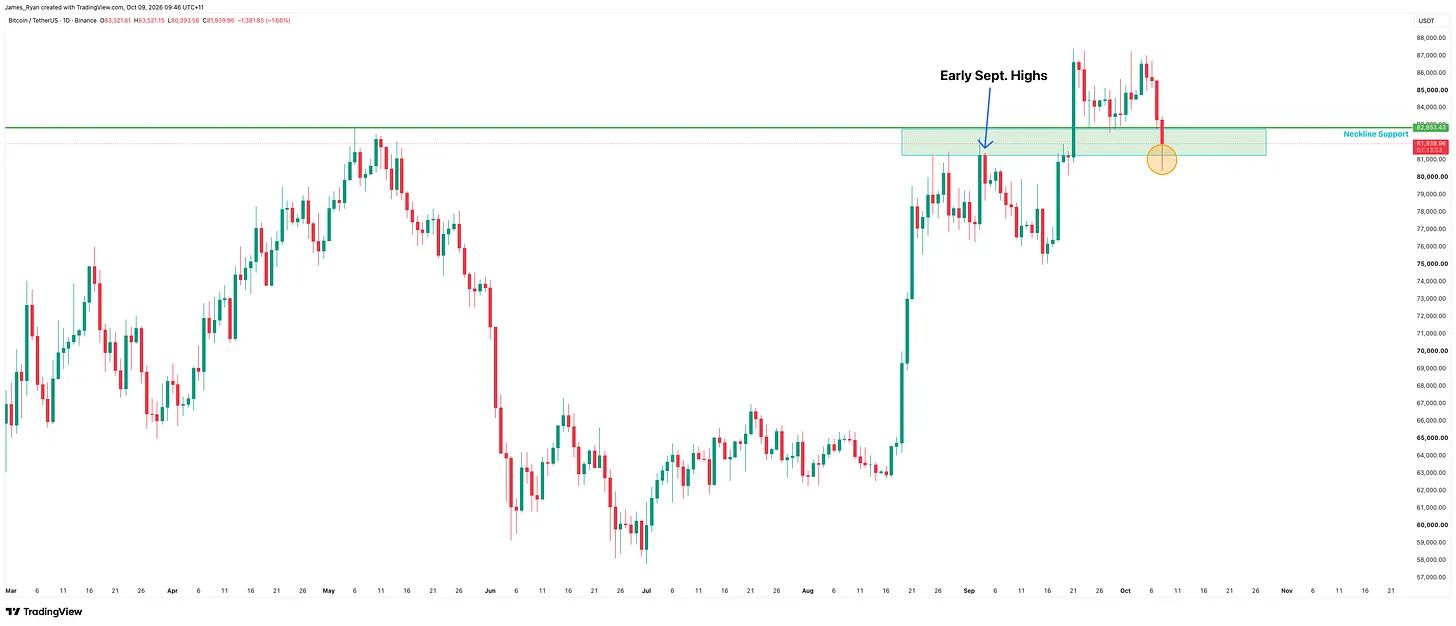
BTC/USD Key Levels and Price Action:
Source: https://www.tradingview.com/x/3e86Qb5W/
Bitcoin’s continued pullback overnight of approximately -3.50% has seen a quick push below the top-end of the neckline support range, however the actual support zone is somewhat wider than just a narrow price level that’s exact to the dollar and cent. The key support zone to watch is actually between $82.8K and $81.2K; the later part is from the early Sept. highs, which was previously resistance, now acting as support. Given this key level, we’ve seen buyers come in quickly overnight to scoop up this excellent discount, with prices already back up nearly 2% in the last few hours this morning. The narrative behind the dip was more AI-related Quantum computing FUD, nothing new to this space over the last few years. As long as we stay above the previous lows around $76K - $75K, trend is still in-tact and bulls remain in longer timeframe control over the coming months ahead.
*All prices are denominated in USD unless stated otherwise*
Written by James Ryan
Disclaimer
This information is general in nature and does not take into account your personal objectives, financial situation, or needs. Before acting, you should consider whether this information is appropriate for your circumstances and seek independent advice if necessary.
Digital assets are volatile and carry significant risk. Past performance is not indicative of future results. You may lose some or all of your investment.