

The Fed Is Hiking Into a $40 Trillion Problem
· Macro Analysis · Stormrake
- BTC
- ZEC

Why stocks, gold and Bitcoin are falling together, and why the US debt clock decides how this ends.
Almost everything has fallen at once this week. Overnight, the Dow dropped 2.2%, the S&P 500 2.0% and the Nasdaq 2.3%. The day before, US time, gold fell 3.5% to about $3,730, its lowest level since September 2025, and Bitcoin posted its lowest daily close since mid-August, near $63,000.
When stocks, gold and Bitcoin fall together, the cause sits underneath all of them: the price of money. When cash and government bonds pay more than 5%, non-yielding assets such as gold and Bitcoin take a tumble. That pressure is temporary. However high rates climb for now, the inevitable direction ends the same way: lower.
Why Everything Is Falling Together
Minutes from the Fed’s October meeting, released early yesterday our time, showed almost all officials expect further rate hikes, with a couple raising the option of more than a quarter point in December. Governor Chris Waller has floated a half-point move.
In response, the US 10-year Treasury yield is holding above 5%, and the US dollar has hit a 19-month high.
The minutes also flagged leverage at hedge funds and the growing debt behind AI spending. When borrowed money meets rising rates, selling comes fast.
The Number Behind It All
The US national debt stood at $40.66 trillion on 16 November. It has roughly doubled in a decade, from $19.6 trillion in 2016, and grew by about $2.5 trillion in the year to September alone.
In the year to September, the US Treasury paid $1.05 trillion in net interest, more than the $965 billion it spent on defence. The Congressional Budget Office expects that annual bill to reach about $2.1 trillion by 2036.
That is what makes it unsustainable: a government running a deficit of almost $2 trillion a year is borrowing to pay interest on what it already owes.
Between a Rock and a Hard Place
This is the Fed’s trap. It is raising rates to bring inflation down, and Washington, the world’s biggest borrower, feels higher rates most.
In January, the average interest rate on US marketable debt was about 3.35%. Today the 10-year yield is above 5%. By our own rough arithmetic, each extra percentage point across roughly $31 trillion of marketable debt adds about $310 billion a year to the interest bill once it has all rolled over.
Bigger interest bills mean bigger deficits, more bonds to sell and more pressure on yields. Neither party has shown any appetite for the spending cuts or tax rises that would break the loop. That leaves one realistic long-term exit: lower rates, more central bank bond buying and a slowly weaker dollar.
Honest About the Short Term
For now, the Fed is choosing to fight inflation, and while it does, pressure on risk assets, Bitcoin included, can persist. For Bitcoin, the line that matters is the $57,800 cycle low. A break below it would point to a deeper downtrend.
Much of this week’s selling is also the market pricing in December’s hike ahead of time. With the odds already above 95%, the move will largely be in the price by the time the Fed acts on 9 December. We saw a version of this in September, when Bitcoin set its low the day before the Fed’s first hike since 2023, then rallied about 15% within three weeks. Once an expected hike is done, a move back up becomes more likely.
The long-term direction is harder to argue with. A fixed supply of 21 million coins was designed for exactly this kind of debt arithmetic.
What We Are Watching
The Fed, 8 to 9 December. The size of the hike, and any hint of how many more are planned.
The 10-year yield. A sustained move further above 5% would tighten the squeeze.
The debt limit. Analysts expect it to be reached around February 2027, putting the debt clock back on the front page.
The Fed can keep raising rates for a while. The debt clock will decide for how long.
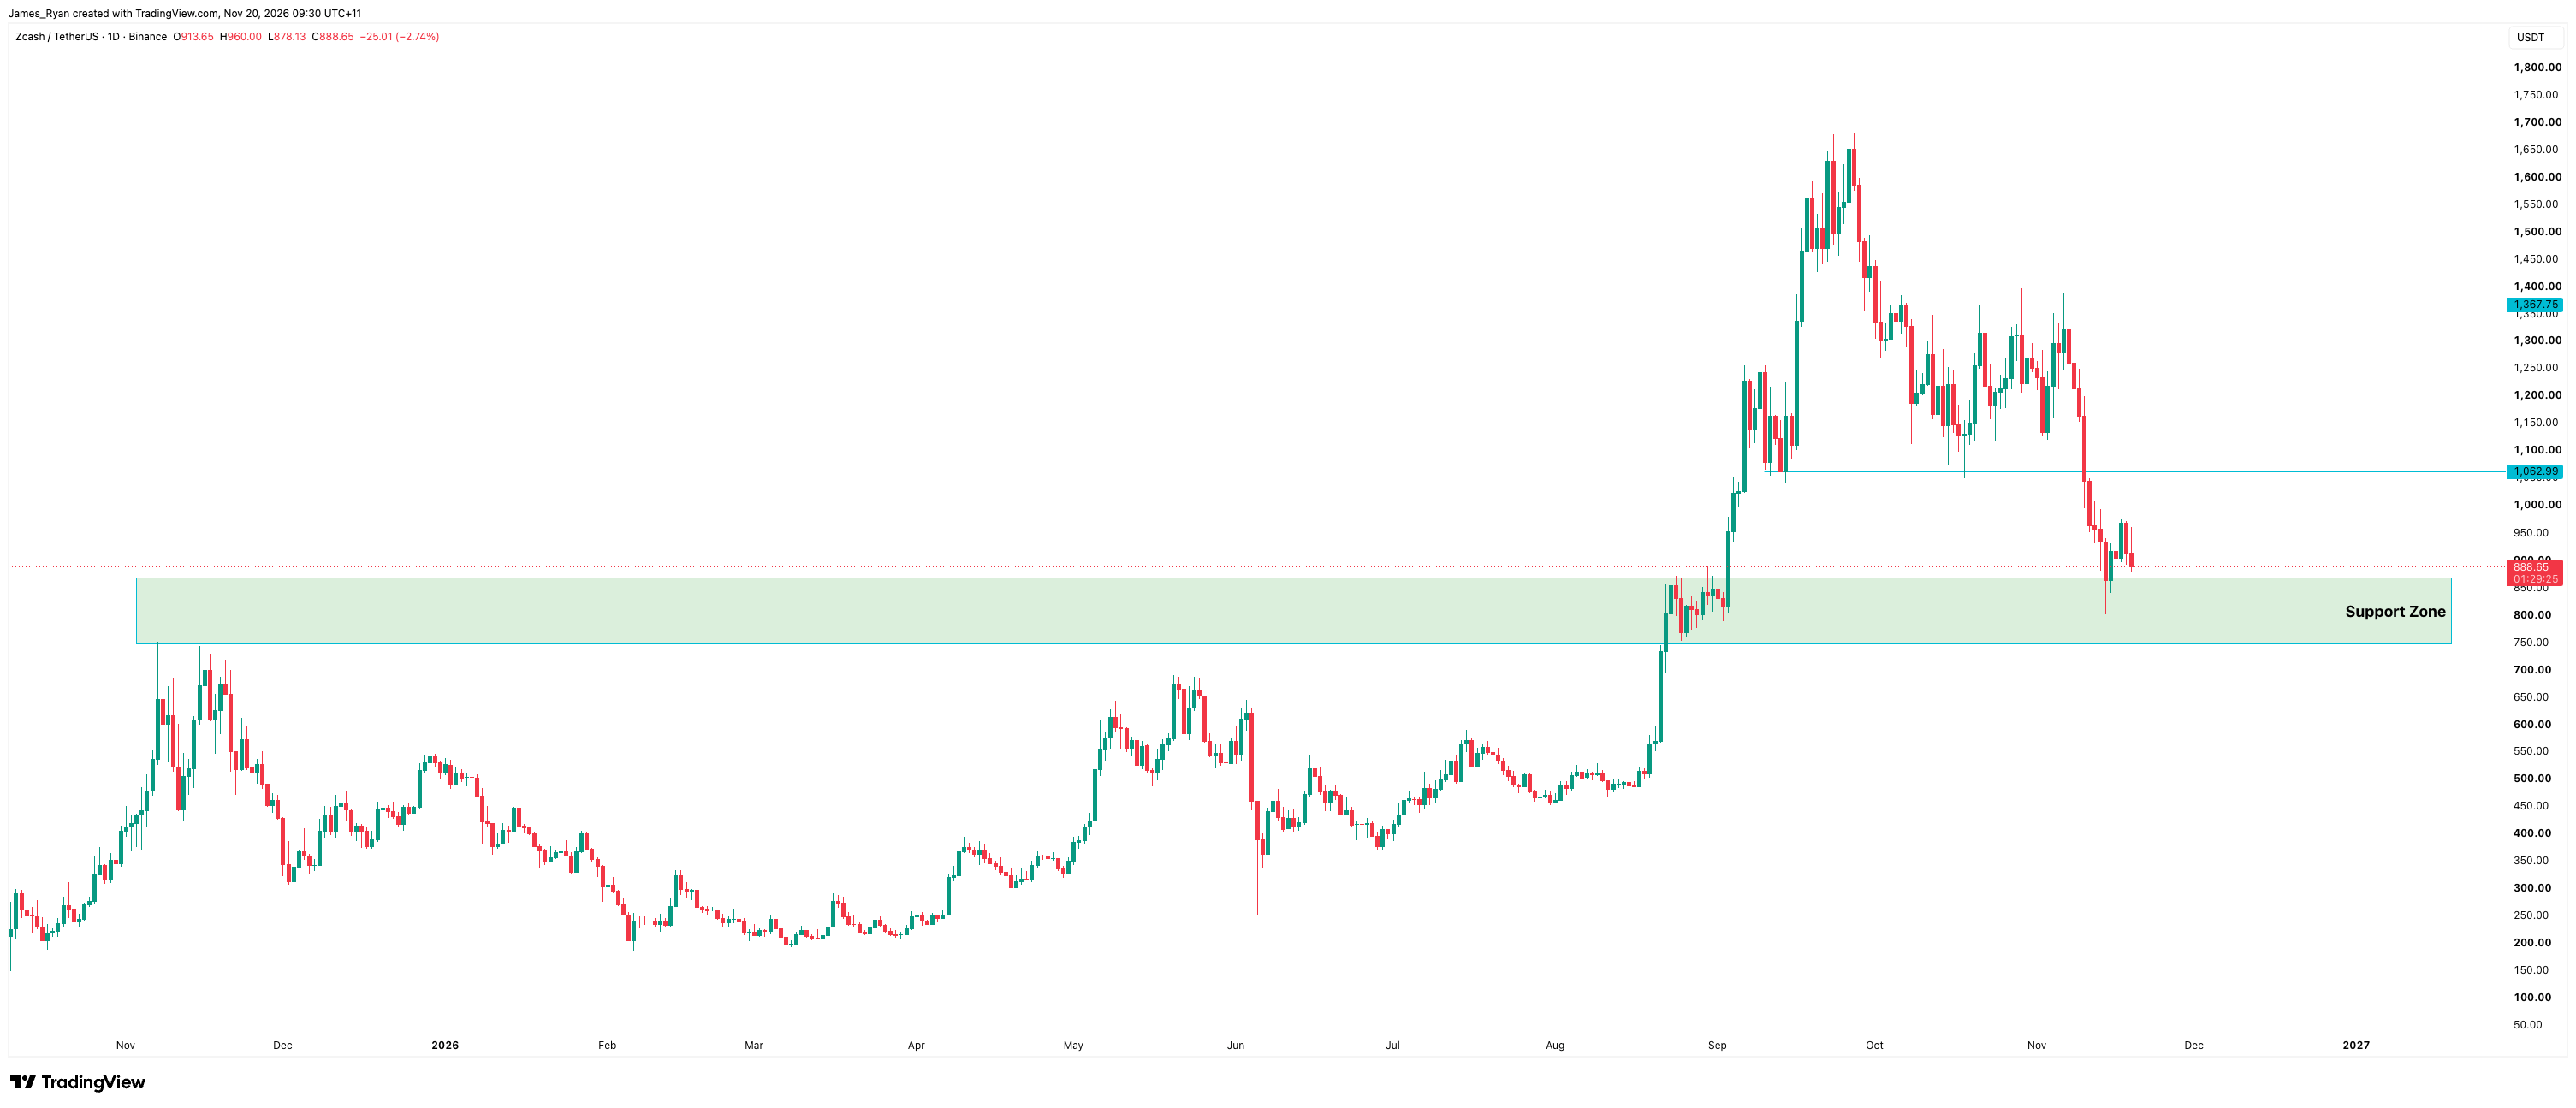
Stormrake Spotlight: Zcash (ZEC) ($888)
Source: https://www.tradingview.com/x/NjZGzZeW/
ZEC's pullback from the $1,650 high has brought price back to the top of the $750 to $870 support zone. This is the same range ZEC broke out of in late August, making this a textbook retest of the breakout. If buyers defend this zone, former resistance flips to support and sets a base for the next leg higher. Some investors may view a dip into this range as an attractive entry. A daily close below the zone would invalidate the setup.
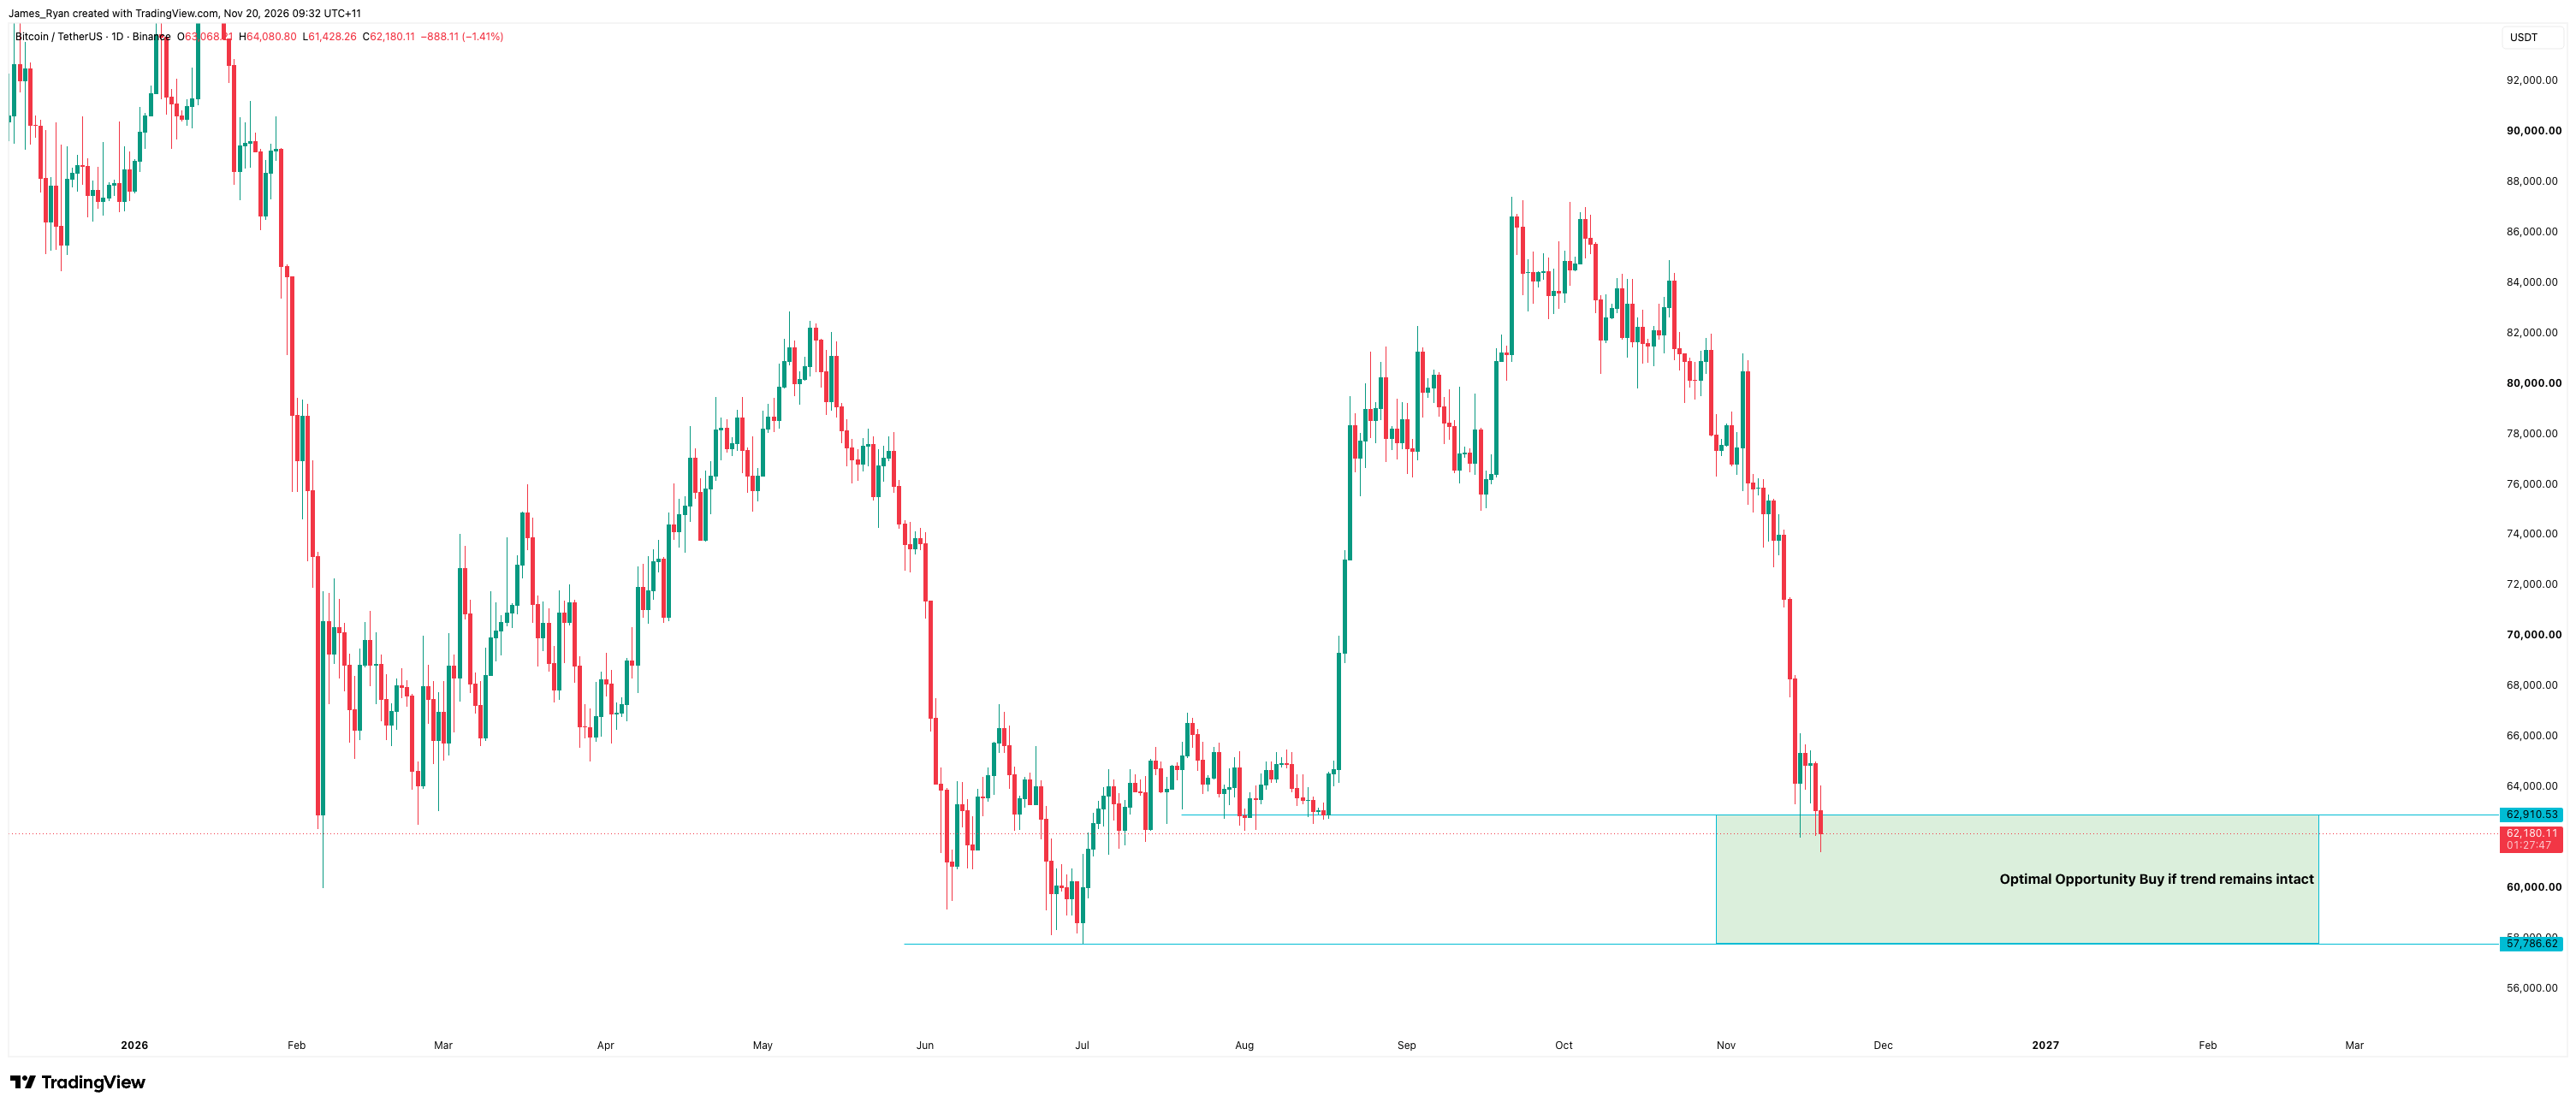
BTC/USD Key Levels and Price Action:
Source: https://www.tradingview.com/x/OEG5C4SK/
Bitcoin's sell-off has extended, down nearly 30% from the October high near $87,000 to trade around $62,000. Price is now entering the opportunity zone between $62,500 and $57,700, a range anchored by the July consolidation lows and the June bottom. Despite the recent selling, the broader macro trend remains intact while BTC holds above the June low. A reversal from within this box over the coming weeks, ahead of the Fed's December meeting, would confirm a higher low on the higher timeframe and mark an attractive area for investors looking to build a position. A decisive daily close below $57,700 would invalidate the setup and open the door to a deeper correction.
*All prices are denominated in USD unless stated otherwise*
Written by James Ryan
Disclaimer
This information is general in nature and does not take into account your personal objectives, financial situation, or needs. Before acting, you should consider whether this information is appropriate for your circumstances and seek independent advice if necessary.
Digital assets are volatile and carry significant risk. Past performance is not indicative of future results. You may lose some or all of your investment.