

The Breakdown Is Real. So Is The Opportunity.
· Breaking News · Stormrake
- BTC
- ZEC

If you stayed away from the charts over the weekend, you missed one of the most volatile days in recent memory. Bitcoin is trading around $65,000 this morning, which looks calm enough. What that number hides is a sharp drop to near $62,000, its lowest level since July, and a quick rally back to $66,000.
Let’s be clear about what this is. Bitcoin has broken down. It lost the 200-week moving average, broke below the range it held for months, and erased most of the rally off the June low. The short-term trend is down.
But look at how it happened. Price fell to $62,000 and buyers stepped in almost immediately, pushing it back up $4,000 within hours. Calls for $40,000 are everywhere and the Fear and Greed Index sits at 10. When everyone is already bearish, a lot of the selling has usually already been done.
What Drove The Fall
This was a forced-selling event. US spot Bitcoin ETFs saw almost $1.9b leave over seven straight sessions. That steady selling pushed price into a crowded set of leveraged longs, and almost $1.5b in positions were wiped out in a single day. Liquidations are painful, but they clear out excess leverage. A market with less leverage is on firmer ground for the next move.
The Anthropic IPO
Some argue money is being pulled out of crypto to fund the Anthropic IPO, which lists this Wednesday at around $1 trillion. There is likely some truth to that, but we have heard it before. The SpaceX IPO got the same blame in June, the month Bitcoin set its cycle low, and Bitcoin is still up around 26% since that listing. Mega-IPOs can drain liquidity in the short term. So far, they have not changed the bigger trend.
The Binance Theory
A popular theory says Binance crashed the price so it could buy back the assets stolen in last month’s hack more cheaply. For context, Binance says it finished replacing the full $6.34b last Thursday, before this weekend’s low. Former CEO CZ has denied that the exchange sold any crypto.
The Real Overhang: Strategy And MSCI
The pressure worth watching is Strategy. MSCI will remove it from its indexes at the 30 November close, and JPMorgan has estimated around $2.8b in forced selling. That selling hits Strategy shares, not Bitcoin directly. The risk is that a weaker Strategy may be less able to keep buying Bitcoin.
The flip side is that this is a known event with a fixed date. Markets tend to sell the fear ahead of time, and once the rebalance is done, the overhang goes with it.
We Have Seen This Before
Source: https://www.tradingview.com/x/ttcZHI4R/
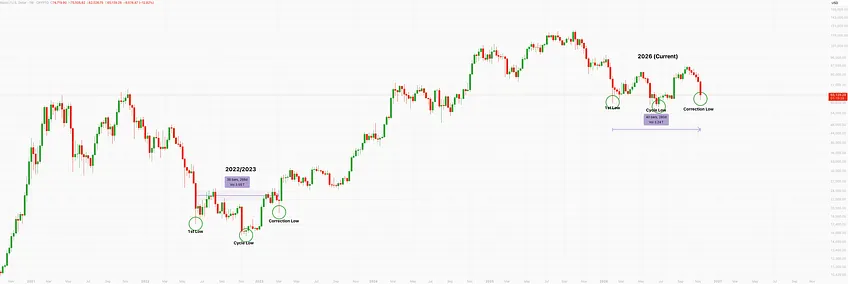
The comparison to 2022 and 2023 is still holding, in price and in timing.
In 2022, Bitcoin set a first low in June and a final cycle low in November. In early 2023 it rallied 60%, then gave back 22.5% during the US banking scare. Sentiment was dire and new lows were widely expected. They never came. That correction low in March 2023 turned out to be the last real shakeout before Bitcoin’s next leg higher.
This cycle has followed the same path: a first low in February, a cycle low near $58,000 in June, then a 51% rally into the current 26.8% correction. The timing lines up too. In 2022/2023, it took 38 weeks to go from the first low to the correction low. This cycle, we are 40 weeks from the first low to this weekend’s low.
The rhyme comes with one condition: the cycle low has to hold. If it does, this weekend could prove to be this cycle’s version of March 2023.
For Long Term Investors
Remember why you bought. For most of our clients, Bitcoin is a long-term position and a bet against currency debasement. Governments are still running deficits, and the case for a scarce asset outside the system is as strong as it was a week ago. A weekend of liquidations does not change that.
A few months ago, many readers said they were waiting for lower prices before buying in the $60,000s. Price is back there. Periods of extreme fear have historically been better times to accumulate than to sell, though they rarely feel that way at the time. If Bitcoin fits your long-term plan, this is a moment for a plan, not a panic. Your Stormrake broker is available to talk it through.
Stormrake Spotlight: Zcash (ZEC) ($907.76)
Source: https://www.tradingview.com/x/Bze6evDo/
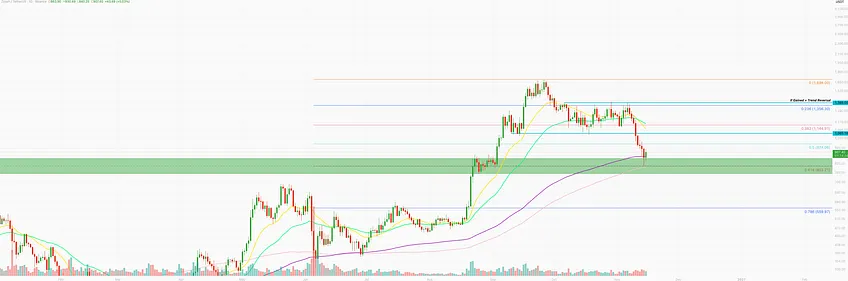
Zcash is pulling back with the rest of the market. It is down around 50% from its September high of $1,698, after breaking out of its October range in early November. This weekend, ZEC fell to $840, right into the $760 to $860 demand zone where it broke out in late August. That zone also lines up with the 0.618 Fibonacci retracement at $803. Buyers stepped in, and price has bounced back to around $907. If this zone holds, the first target is $1,065, and a reclaim of $1,385 would signal a trend reversal.
BTC/USD Key Levels and Price Action:
Source: https://www.tradingview.com/x/994ftvwU/
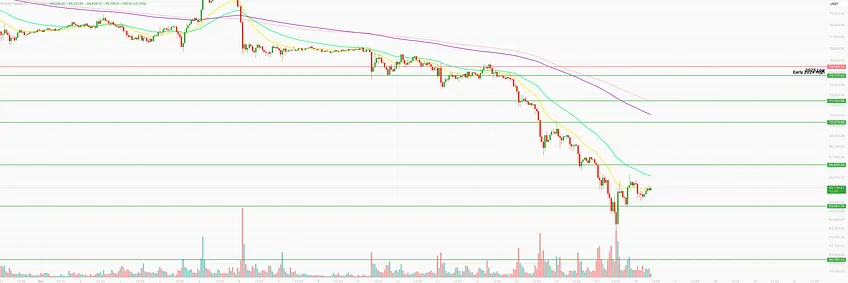
Bitcoin’s breakdown started when it lost the $73,800 to $74,500 zone, the early 2024 high and the 2025 low. Once that floor gave way, the sell-off picked up pace, slicing through $70,000 and $66,850 before briefly dipping below $62,000. Buyers defended the low hard. Price quickly reclaimed $63,860 and is now trading around $65,200, but it is still pressed under the short-term moving averages. To build a V-shaped reversal, Bitcoin needs to hold $63,860 and break back above $66,850. Reclaiming $70,000 above that would be a constructive sign. If $63,860 fails, a retest of the lows comes first, and below that $60,000 is the next major support.
*All prices are denominated in USD unless stated otherwise*
Written by Alexandar Artis
Disclaimer
This information is general in nature and does not take into account your personal objectives, financial situation, or needs. Before acting, you should consider whether this information is appropriate for your circumstances and seek independent advice if necessary.
Digital assets are volatile and carry significant risk. Past performance is not indicative of future results. You may lose some or all of your investment.