

Changing Hands
· Breaking News · Stormrake
- BTC
- ZEC

Bitcoin slid overnight to its lowest level in nearly 12 weeks, trading as low as $71,200. The headlines are about Nvidia and the Fed. For anyone holding Bitcoin, a simpler question is more useful: who is selling, and who is buying?
The answer is changing. The biggest corporate buyer of this cycle is now spending more on itself than on Bitcoin. Small holders are emptying their wallets. And a middle group of holders is quietly adding.
The Biggest Buyer Steps Back
Strategy has been the market’s most reliable buyer for years. That is changing.
In the week to 8 November, Strategy sold MSTR shares for $283.8m. $188.3m of that went to buying back its STRC preferred shares, $81.9m went to Bitcoin and $13.6m was held as cash. The week before was similar. Across its last two weekly filings, Strategy has spent $396.5m on STRC buybacks and $147.4m on Bitcoin.
The reason is STRC itself. It’s a preferred share built to trade near $100 and pay a monthly dividend. Strategy’s policy is not to issue new STRC below $100, which cuts off that source of funding while the stock trades under target. So Strategy buys STRC back to defend the price, and that money no longer goes into Bitcoin. In August it went a step further: Strategy sold Bitcoin for the second week in a row to fund STRC buybacks.
The price is now working against it too. Strategy holds 850,364 BTC at an average cost of $75,456. At the time of writing, that stack is around 5% below cost. Then there’s the MSCI removal on 30 November, which we flagged yesterday.
The ETF picture looks similar. US spot Bitcoin ETFs have had five straight days of outflows, around $1.44bn since 5 November. Most of that comes from one fund: BlackRock’s IBIT accounts for about 94% of November’s Bitcoin ETF outflows. That looks like one large fund being rebalanced, not institutions leaving across the board.
The Wrapper Is Not the Asset
It’s worth being clear about what this is, and what it isn’t.
Strategy is a company. Michael Saylor is its chairman. An ETF is a fund. Each one gives investors exposure to Bitcoin, but none of them is Bitcoin. Strategy’s choices about funding, a preferred share trading below $100, or MSCI removing it from an index are problems for Strategy and its shareholders. ETF outflows are investors leaving a fund. Neither changes how Bitcoin works.
Bitcoin’s supply schedule is the same as it was last week. The network is still producing blocks. No company’s balance sheet or fund’s redemptions can change the rules underneath.
That doesn’t make these flows irrelevant. Strategy and the ETFs have been major buyers this cycle, and when they step back, price feels it. In the short term, the vehicles can move the market. Over the long term, Bitcoin rests on the asset itself: its fixed supply, the network and who chooses to hold it.
For holders, the risks sit in different places. Holding MSTR means taking on Strategy’s debt, its preferred share obligations and decisions made by its management. Holding an ETF means relying on the fund’s structure and the flows of other investors. Holding Bitcoin directly carries none of those layers. Price risk is still there, but it isn’t tied to anyone else’s balance sheet.
Retail Sells, Sharks Buy
The on-chain data tells a different story. Non-empty Bitcoin wallets peaked at 59.99m on 16 October, and roughly 108,700 have disappeared since. At the same time, wallets holding between 1 and 100 BTC have been adding Bitcoin.
Small holders giving up while mid-sized holders buy is a pattern that often shows up in the later stages of a sell-off. It isn’t a timing signal, and the numbers are modest. The fall is about 0.18% of wallets, and some of it is consolidation rather than investors leaving.
This is the setup we described in our Q4 Outlook, The Recovery Nobody Believes. Coins are moving from impatient hands to patient ones while sentiment says the opposite.
At the time of writing, Bitcoin is trading below its 200-day moving average, near $73.2k. Yesterday we flagged that line as the one separating a pullback within an uptrend from something deeper. We cover the levels below.
Stormrake Spotlight: Zcash (ZEC) ($956)
Source: https://www.tradingview.com/x/fxrGsagR/
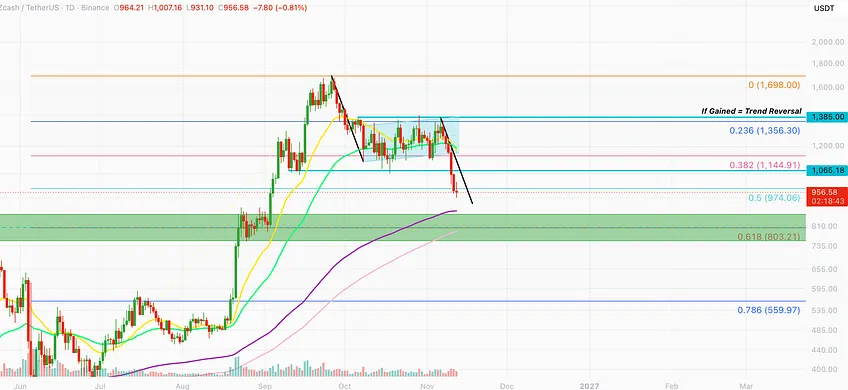
ZEC’s bear flag is playing out almost exactly as drawn. After dropping from $1,698, ZEC drifted higher through October in a narrow rising channel, then broke down through the $1,065 floor and below the 0.5 Fibonacci level near $974. The projected move points into the green support zone between $750 and $865, where the 0.618 Fibonacci level at $803 and ZEC’s rising long-term moving averages meet. That’s where buyers are most likely to step in. Reclaiming $1,065 would be the first sign of strength, and a move above $1,385 would signal a full trend reversal.
BTC/USD Key Levels and Price Action:
Source: https://www.tradingview.com/x/mETCQ9vX/
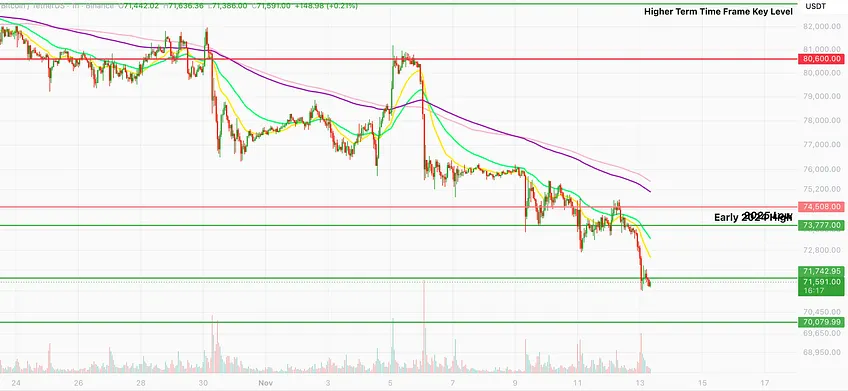
Bitcoin has lost $73.8k, the level that marks both the early 2024 high and the 2025 low, after Nvidia’s leadership shock added to the selling. Price is now testing support at $71.7k. Every bounce this month has been sold at a lower high, and the short-term moving averages are all sloping down overhead. If $71.7k holds, a move back above $73.8k would be the first sign the slide is stalling, with $74.5k the next resistance. If it gives way, $70k is the next major support.
*All prices are denominated in USD unless stated otherwise*
Written by Alexandar Artis
Disclaimer
This information is general in nature and does not take into account your personal objectives, financial situation, or needs. Before acting, you should consider whether this information is appropriate for your circumstances and seek independent advice if necessary.
Digital assets are volatile and carry significant risk. Past performance is not indicative of future results. You may lose some or all of your investment.