

March 2020 Also Felt Like the End. It Was Only the Beginning.
· Macro Analysis · Stormrake
- BTC
- ZEC

Back then, Bitcoin gave back almost its entire rally, then rose 18x. Here is how this cycle compares.
Yesterday we set out what drove the weekend’s fall to about $62,000 and why it looked like forced selling. Today we go back further, to the last liquidation cascade that felt this violent. Several market analysts reached for the same comparison over the weekend: March 2020.
A Quick Refresher on March 2020
In early 2020, Covid-19 was spreading across the world and governments were starting to lock down. Investors rushed into cash. A price war between Saudi Arabia and Russia sent oil down about 24% in a single day on 9 March, and the S&P 500 fell 34% in just over a month.
Bitcoin was caught in the stampede. On 12 March, “Black Thursday”, it fell almost 40% in a day, its worst day since 2013, and early on 13 March it touched about $3,800. More than $1bn of leveraged positions were wiped out on BitMEX alone, and the exchange briefly went offline as the selling overwhelmed it.
The cause was the same machinery we saw at the weekend: leverage. Each forced sale pushed the price lower and triggered the next.
Up Fourfold, Then Almost All the Way Back
The bigger picture made it hurt even more. Bitcoin had bottomed at about $3,200 in December 2018, then more than quadrupled to about $13,880 by June 2019.
Over the next nine months it bled almost all of it away. The March 2020 crash took Bitcoin about 73% below the June 2019 high, erasing roughly 94% of the rally. The one thing that held was the low. At about $3,800, the March 2020 bottom landed about 19% above the December 2018 low, a higher low that set up everything that followed.
This Cycle, on a Smaller Scale
This cycle has now traced a similar shape. From the $57,800 cycle low in June, Bitcoin rallied about 51% to $87,400 in October. At Sunday’s low near $61,946 on Coinbase, it had given back about 29% from that high, roughly 86% of the rally.
The moves are smaller this time, both up and down, which fits a larger and more mature market. The structure is the same: a strong rally, a deep give-back, and a low that so far sits about 7% above the cycle low.
The Snake That Eats Its Own Tail
The ancient symbol of the ouroboros, a snake swallowing its own tail, describes Bitcoin’s cycles well. Each rally invites leverage, the leverage eventually devours the rally, and the wreckage becomes the base for the next leg higher.
March 2020 followed that loop, and so has this weekend. The traders who borrowed to chase the move to $87,400 became the forced sellers who drove the price back towards $62,000. Once that leverage is consumed, the cycle has room to begin again.
What It Felt Like, and What Came Next
In March 2020, holding Bitcoin felt reckless. The world was shutting down, the idea of Bitcoin as a safe haven looked broken, and lower prices seemed certain.
Then the money printers switched back on. The Fed cut rates to near zero on 15 March, announced unlimited bond buying on 23 March, and Congress passed the $2.2 trillion CARES Act on 27 March. The Fed’s balance sheet grew by more than $3 trillion within three months.
Bitcoin was back above its pre-crash level within weeks, set a new all-time high above $20,000 in December 2020, and reached $69,000 in November 2021, about 18 times its March 2020 low, in under 20 months. Those who held through the panic, and especially those who added during it, were the ones who captured that move.
Volatility Is Where the Opportunity Lives
Bitcoin’s volatility is the reason some people stay away, and it is also the source of its biggest opportunities.
In February 2020, $10,000 bought less than one Bitcoin. A month later, at the March low, the same $10,000 bought about 2.6 Bitcoin. This weekend, $10,000 bought about 41% more Bitcoin than it did at October’s high.
Forced-selling events like this are rare, and they are uncomfortable by design. The discount is only available to those prepared to act while the headlines are at their worst.
The Line That Matters
The comparison holds as long as the cycle low does. A break below $57,800 would mark a new downtrend and change the picture. Until then, this cycle is following the path that, in 2020, led from a higher low to new all-time highs.
In March 2020, the fear was loudest right at the bottom, and the snake went on to begin its next loop. This weekend, the fear was at it’s loudest once again.
Stormrake Spotlight: Zcash (ZEC) ($906)
Source: https://www.tradingview.com/x/zzGkKJ4m/
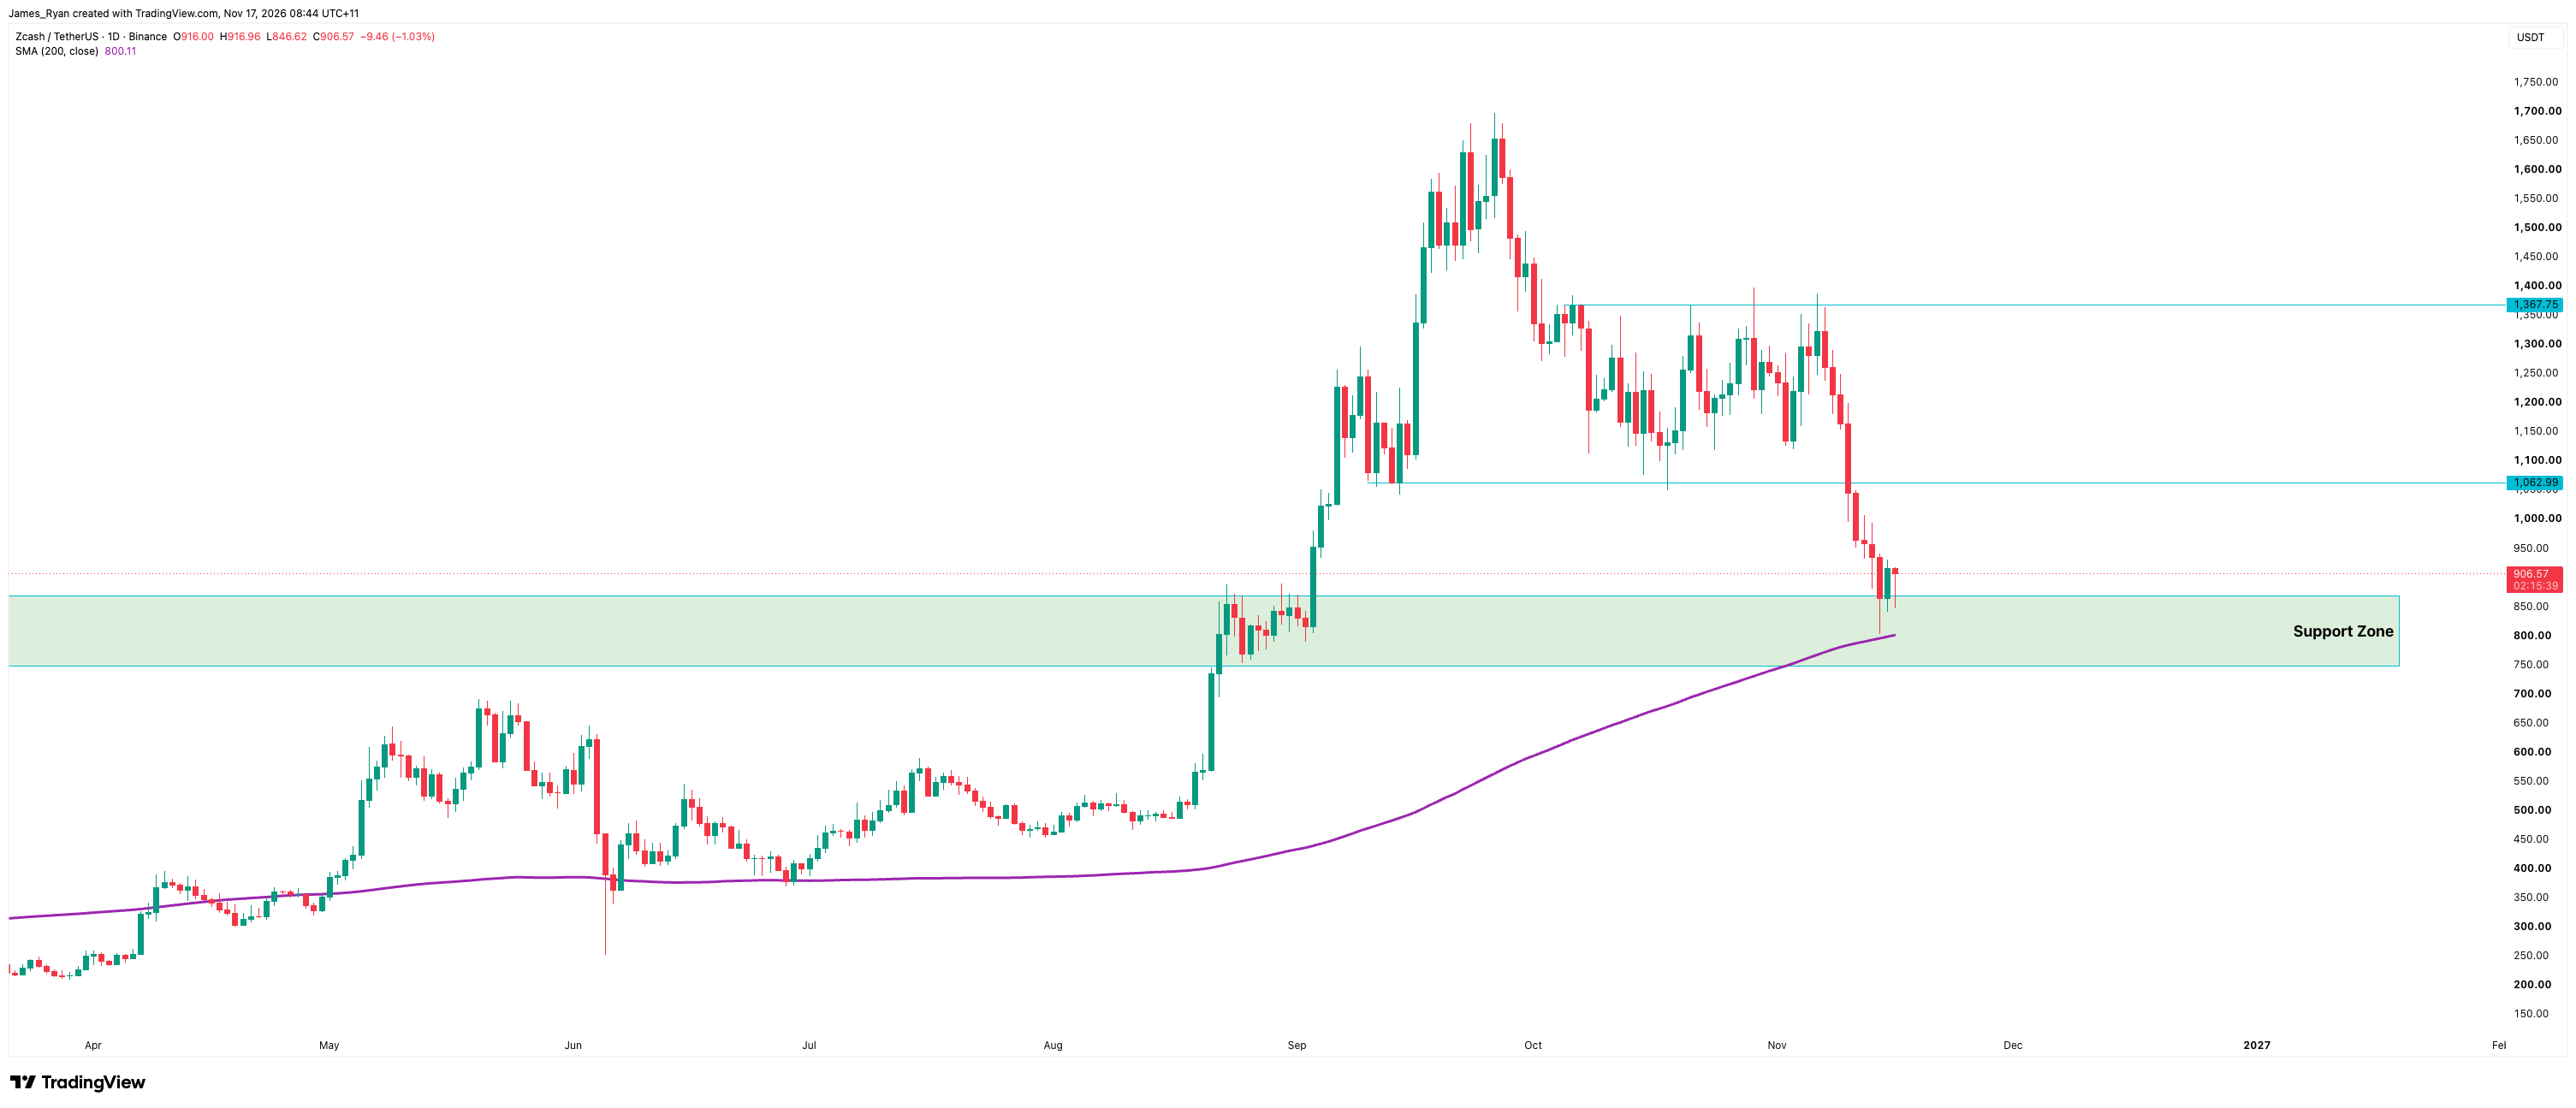
The retest we flagged last week has played out. After breaking below its consolidation channel at $1,063, ZEC slid into our support zone between $750 and $865, wicking as low as $801 on Sunday. That low landed almost exactly on the 200 daily moving average, now sitting at $800, and buyers stepped in immediately.
ZEC has since reclaimed the top of the zone and is trading back above $900. With the support zone and the 200 daily moving average lining up at the same level, this is a strong area of confluence, and so far it is holding.
If the bounce can build, $1,063 is the next level to reclaim and would put ZEC back inside its former range. A daily close back below $800 would weaken the structure and bring the bottom of the zone at $750 into play.
BTC/USD Key Levels and Price Action:
Source: https://www.tradingview.com/x/HsRVOZdF/
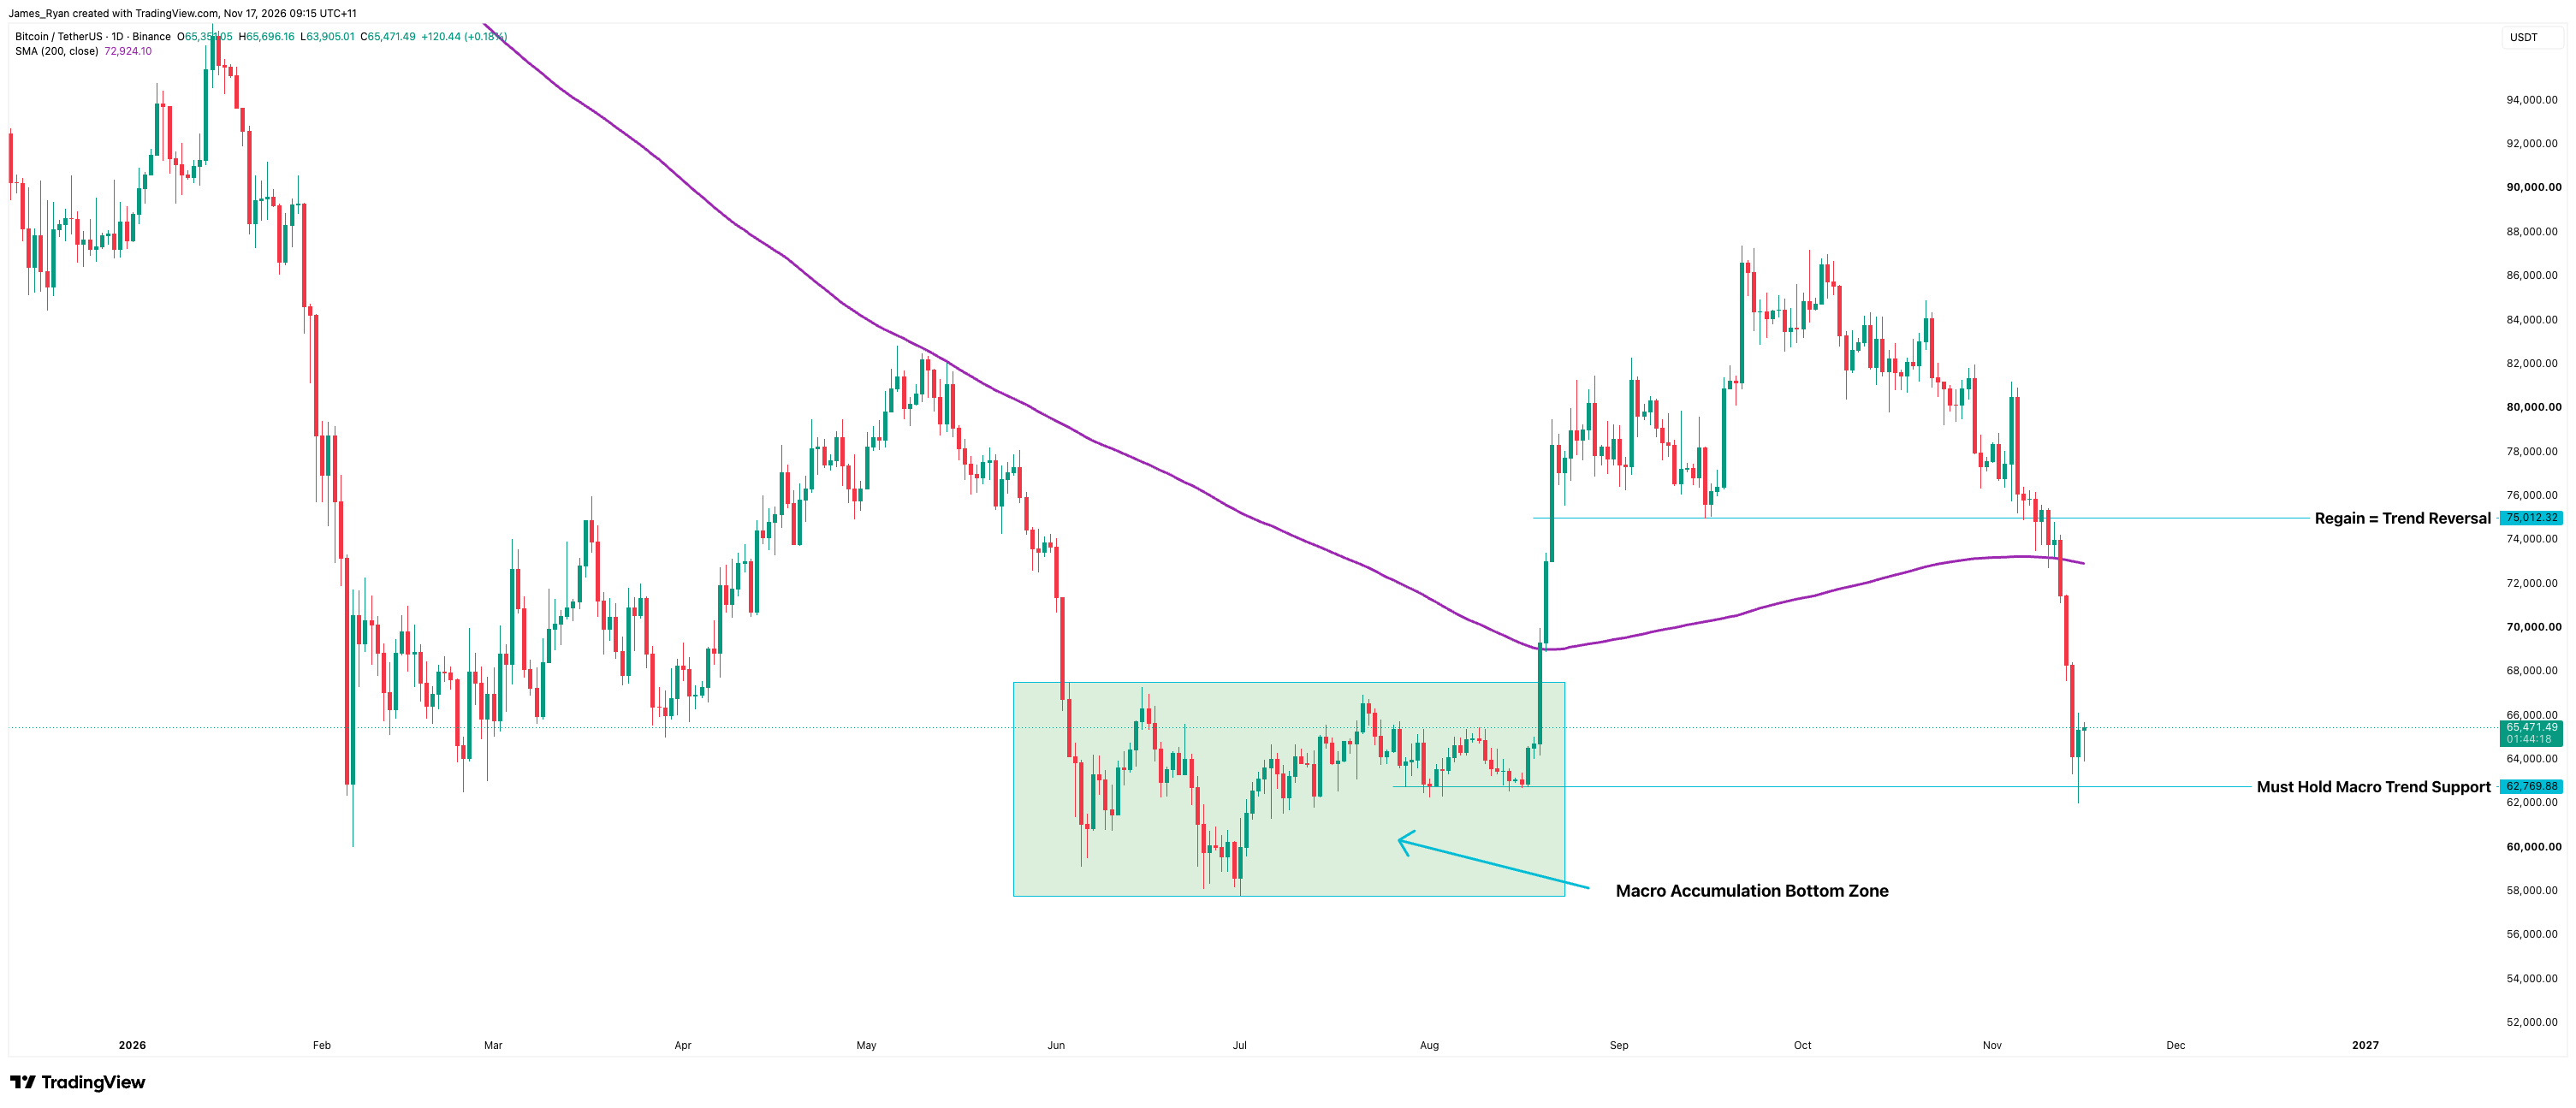
It has been a heavy week for Bitcoin. After losing the 200 daily moving average on Thursday, now sitting at $72.9K, price slid back into the macro accumulation bottom zone between $57.8K and $67.5K, the range Bitcoin spent the summer building before its August breakout.
So far, the line is holding. Sunday's selling wicked to $62K, briefly piercing our must hold macro trend support at $62.8K, but buyers stepped straight back in and the daily candle closed well above it. Price has since steadied around $65.5K.
The bigger picture remains intact. Bitcoin is still holding above both the accumulation zone floor and this cycle's low at $57.8K, printed on 1 July, so the macro higher low structure has not been broken.
In the short term, the bulls have work to do. Regaining $75K is the key level to flip the local trend back to bullish, and would also put the 200 daily moving average back beneath price. Until then, $62.8K is the level that must hold on a daily closing basis.
*All prices are denominated in USD unless stated otherwise*
Written by James Ryan
Disclaimer
This information is general in nature and does not take into account your personal objectives, financial situation, or needs. Before acting, you should consider whether this information is appropriate for your circumstances and seek independent advice if necessary.
Digital assets are volatile and carry significant risk. Past performance is not indicative of future results. You may lose some or all of your investment.