

Hasta La Vista, Bears: The 2023 Cycle Said It Would Be Back
· Technical Analysis · Stormrake
- BTC
- ZEC

In the early stages of the last bull run, the shakeout came right before a +26% week.
Bitcoin has just printed its third red weekly candle in a row. Last week closed around $80,100, and over the weekend price slipped below $80,000 to about $79,200, roughly 9% under the $87,400 high.
Three red weeks after a strong breakout can feel like the start of something worse. We have seen this stretch before, and the chart below shows where it led last time.
2023’s Scariest Week Came Right Before a +26% One
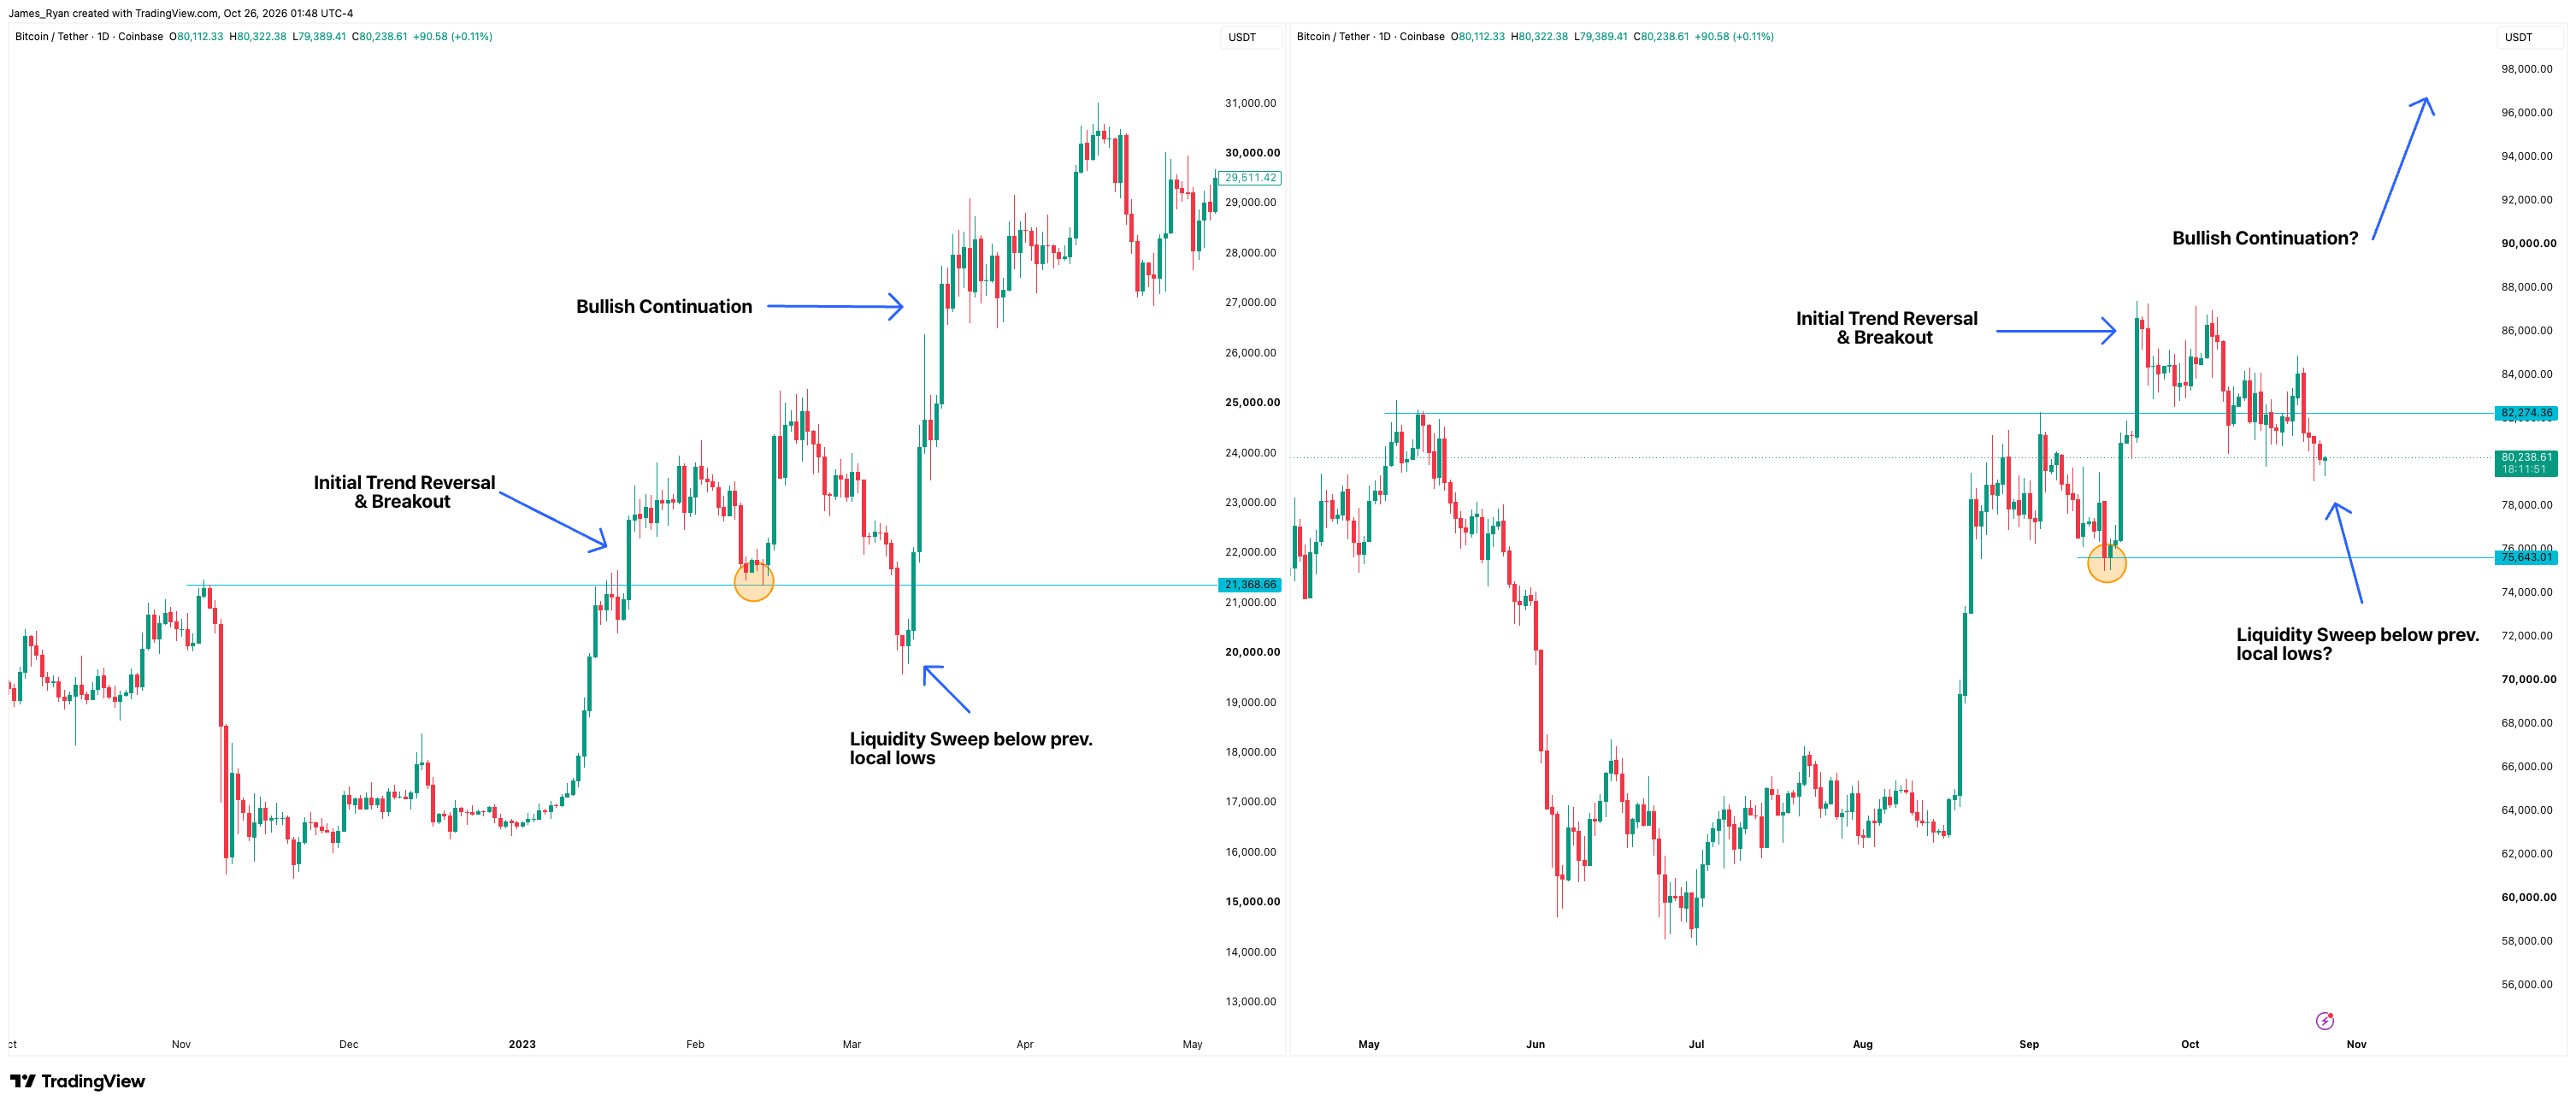
In January 2023, Bitcoin rallied 21.96% in a single week, then broke above about $21,400, the level it had reached days before the FTX collapse. That was the initial trend reversal and breakout. In mid-February, price came back to retest that level, held it, then pushed to just above $25,000.
Then came three red weeks. The third was the hardest to sit through. On 10 March, as Silvergate wound down and Silicon Valley Bank collapsed, Bitcoin swept below its previous local lows and under $20,000, its lowest level since mid-January.
Traders call that a liquidity sweep: a quick drop below obvious lows that triggers stop-losses and shakes out nervous holders before price turns higher. Within days Bitcoin was back above $21,400. The following week it rose 26%, and by mid-April it was trading near $31,000.
Source: https://www.tradingview.com/x/98iLeaX1/
Same Steps, Bigger Numbers
The 2026 chart has followed the same map. The August surge lifted Bitcoin off its lows. After a dip to about $75,600 in mid-September, in the week the Fed hiked and the CLARITY Act stalled in the Senate, Bitcoin broke above its May high near $82,300 and ran to $87,400. That was this cycle’s initial trend reversal and breakout.
Now we have three red weeks, with the price back under $82,300. On the 2023 map, this is the pullback stage, the stretch that shook out late buyers before the next leg. The matching local low this time is the September low near $75,600.
Two Floors, One Zone
The September low sits near $75,600. Just beneath it, the short-term holder cost basis, the average price paid by recent buyers, has risen to about $74,600.
That puts the market’s last higher low and the average cost of new money in the same zone. Stop-losses tend to cluster just under lows like this, which is exactly what a sweep goes looking for. In 2023, price swept below the matching zone, reclaimed it within days, and that reclaim became the launch pad.
Pullbacks this cycle have also run shallower. This one is about 9% at its low, against a drop of more than 20% into the March 2023 sweep, so Bitcoin may mirror the early stages of that setup without a full sweep below $75,600. We are presenting one possible path, and this cycle has already shown a habit of skipping the full downside while running ahead of schedule: the low held at $57,800, above the $50,000 to $55,000 capitulation zone, and arrived about three months early on the 365-day bear market cycle model.
2023 Climbed Through Rate Hikes
The Fed raised rates in February and again in March 2023. Bitcoin still climbed from under $17,000 at the start of the year to around $31,000 by mid-April.
This week’s Fed decision lands at 5:00 am Thursday (AEDT), with Chair Kevin Warsh’s press conference at 5:30 am. Markets price about a 9% chance of a hike this week and 84% for December. The 2023 chart shows an early bull market can climb through a hiking Fed.
What We Are Watching
The September low near $75,600. A quick sweep below it would mirror 2023’s March flush, and a fast reclaim keeps the roadmap on track, if that even comes.
Thursday’s Fed decision. A hold with no hawkish surprise takes pressure off risk assets heading into the 3 November midterms.
A close back above $82,300. Reclaiming the May high puts the September breakout back in play and reopens $87,400. In 2023, Bitcoin went from the sweep to a new high for the year in four days.
In 2023, three red weeks and a sweep set up a 26% week. Bitcoin is in that same pullback stage today.
Stormrake Spotlight: Zcash (ZEC) ($1,232)
Source: https://www.tradingview.com/x/KvExTYqv/
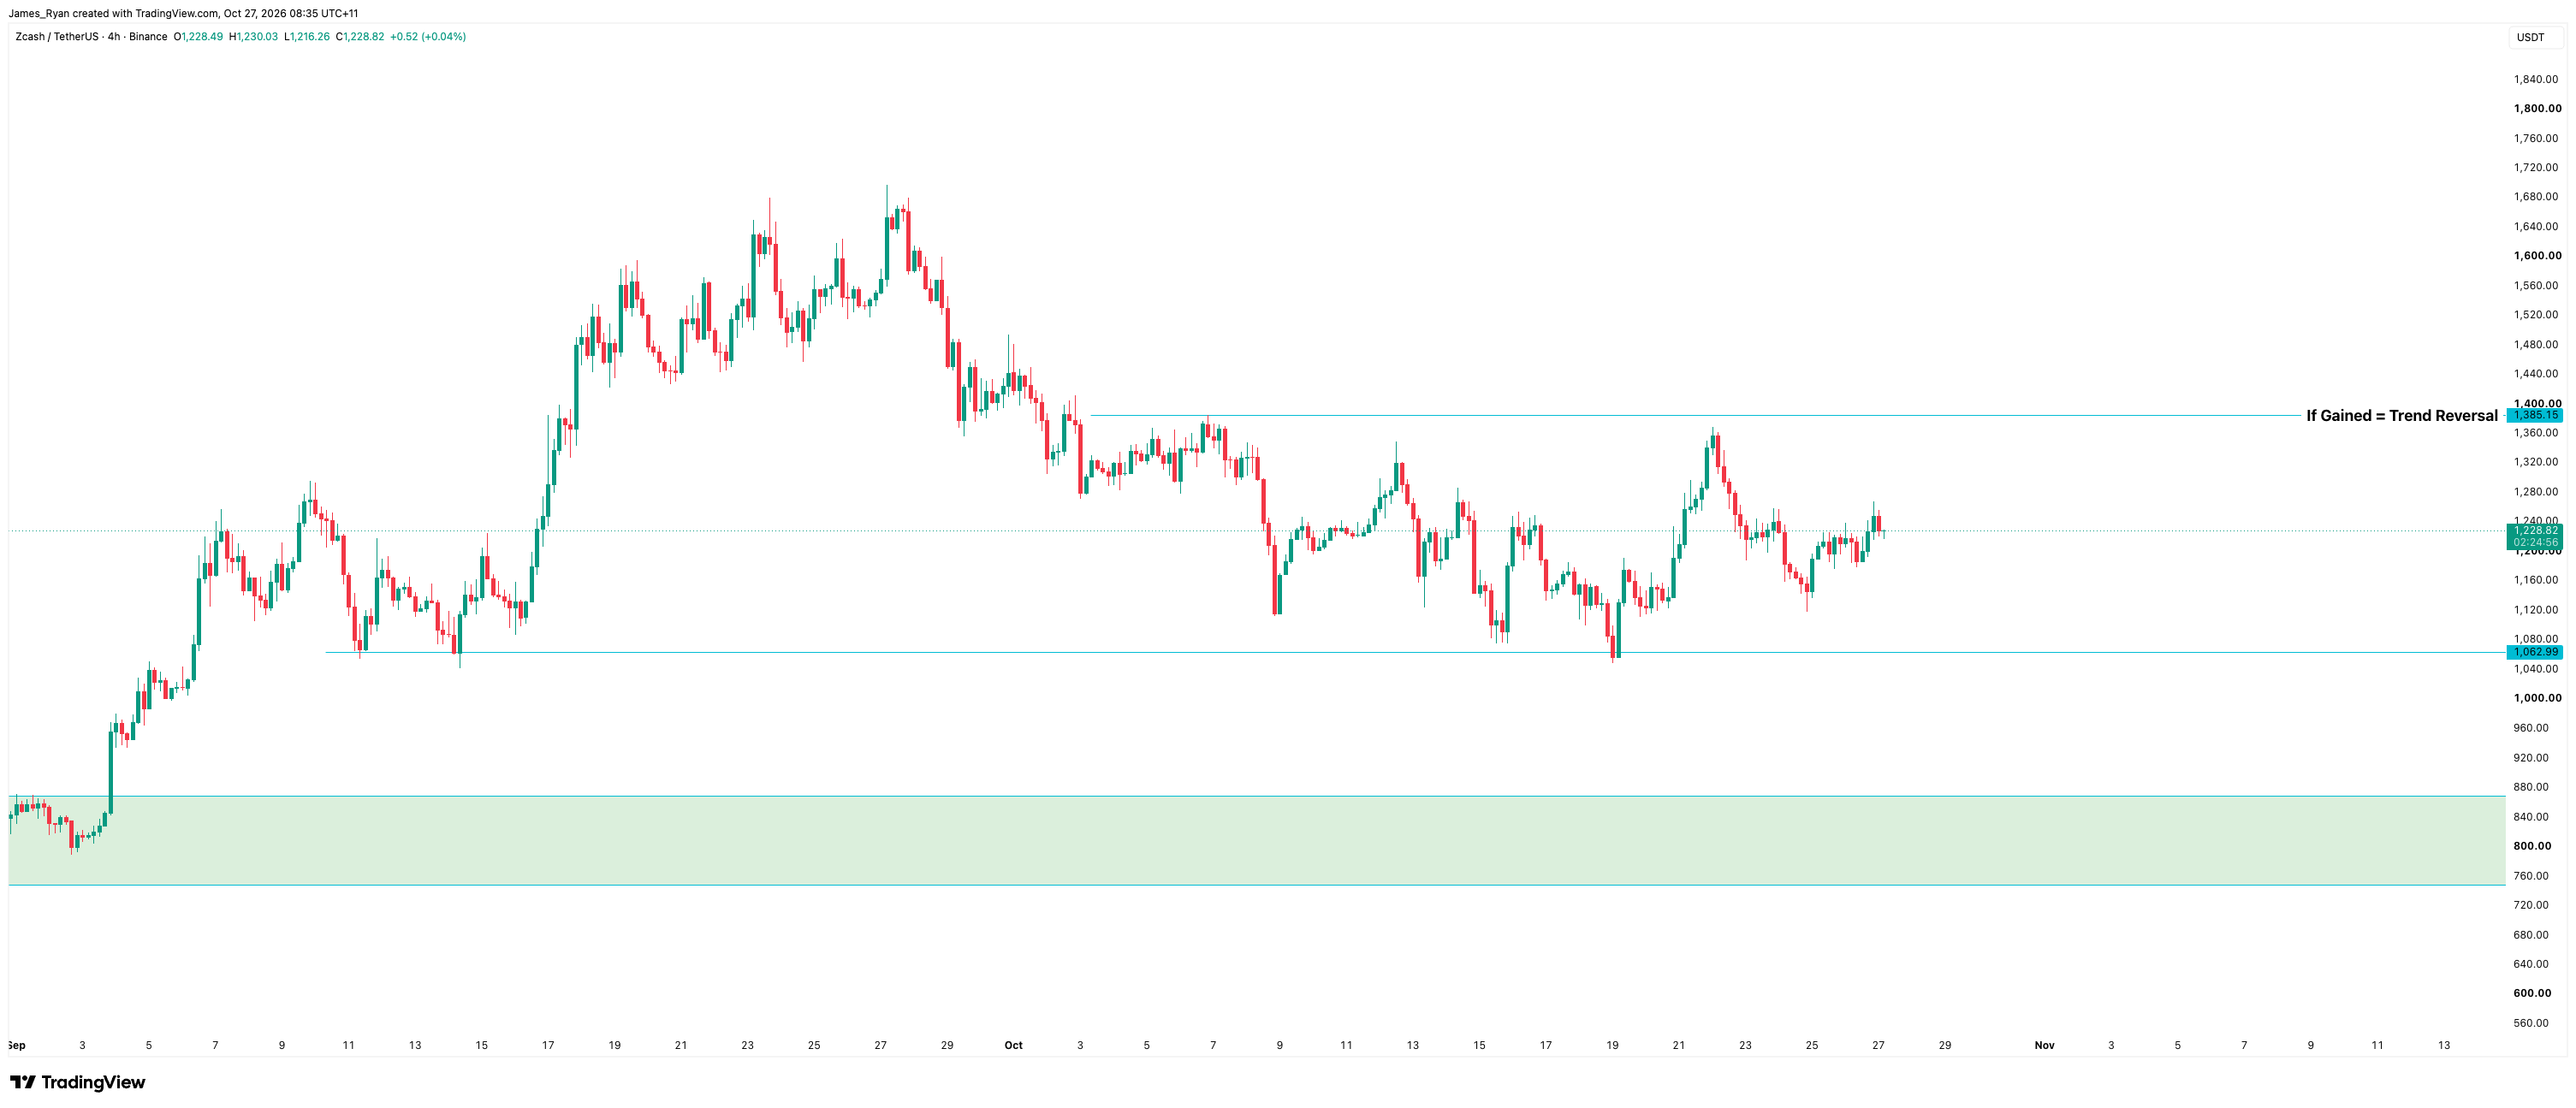
Zcash (ZEC) remains smack-bang in the middle of the two levels as of this morning that’ll decide short-term trend direction. Until a decisive break of either level, more chop and re-accumulation is expected for ZEC. Given the volatility in macro headlines this week leading up to the FOMC, it’ll likely follow the trajectory of BTC’s volatility surrounding the news.
BTC/USD Key Levels and Price Action:
Source: https://www.tradingview.com/x/MGh6Ql85/
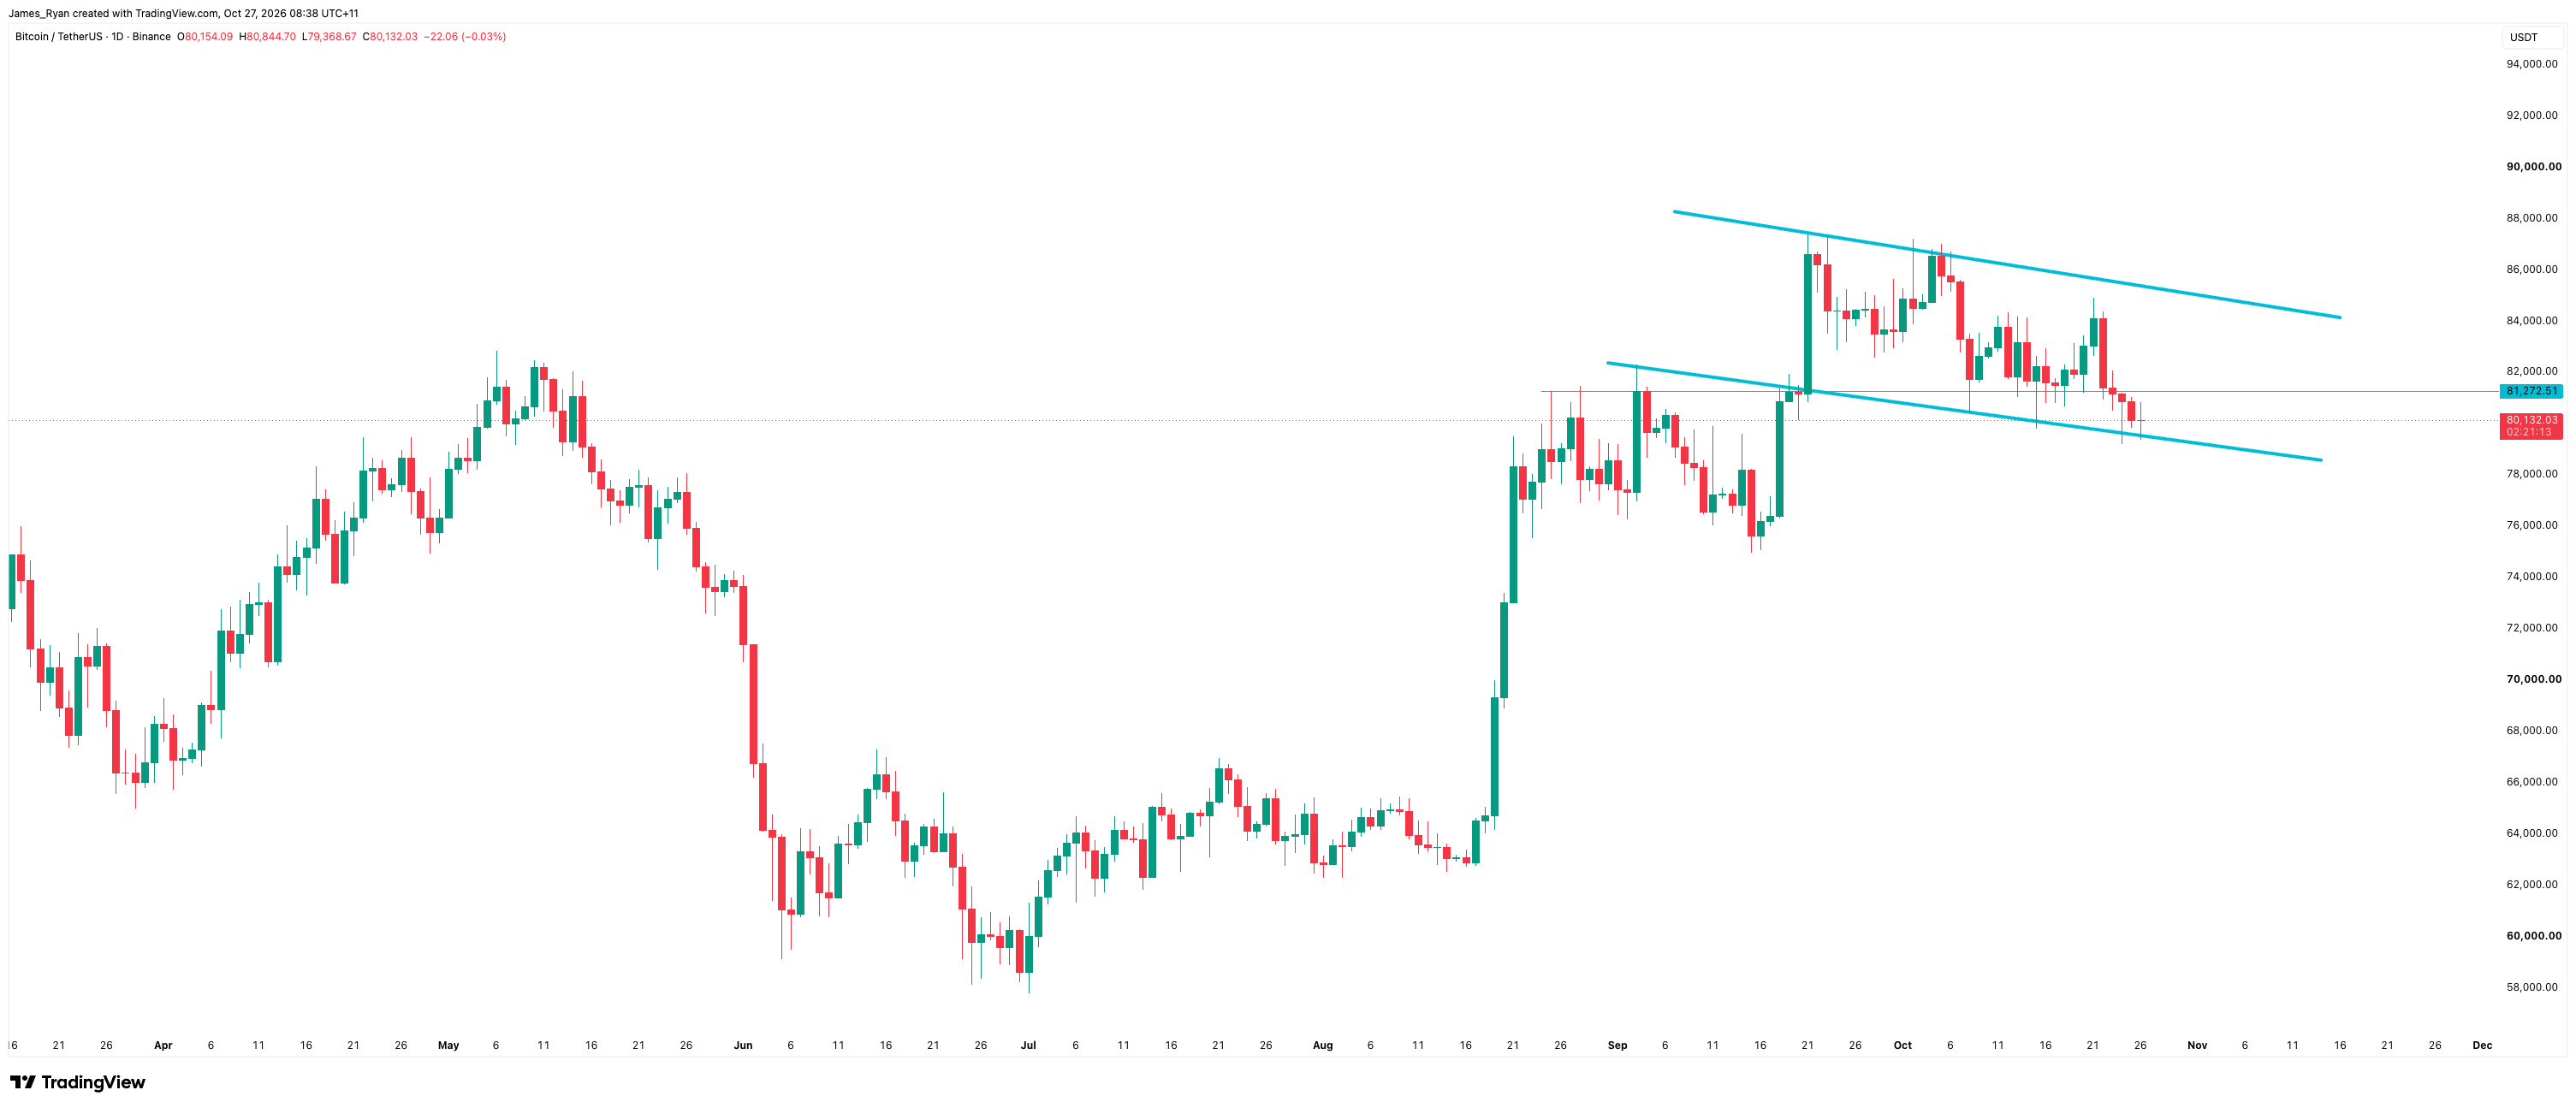
Whilst Bitcoin has quickly swept below the early-Sept. highs and is resting on the lower-end of the $80K support range, it hasn’t decisively continued to cascade lower either. Rather, BTC is holding a familiar channel, accumulating downwards - as avid readers of our note will recognise this bullish pattern. Bitcoin appears to be bull flagging once again in the short-term. Invalidation would be that sweep to $75K or below, however it is important to remember, trend is still in favour of bulls until previous lows on the way up are lost - we haven’t lost anything yet despite the recent selling. If we see significant buying volume come in to break above this channel in the coming days/weeks ahead, that’ll be very telling that we’re right on track to continue higher into the $90K+ region.
*All prices are denominated in USD unless stated otherwise*
Written by James Ryan