

Meet the Sellers.
· Technical Analysis · Stormrake
- BTC
- PAXG
Two weeks ago in Return of the Institutions we said the move above $80,000 was a genuine institutional bid rather than leverage chasing itself in circles.
The bid did exactly what we said it would do.
Bitcoin was trading at $78,500 that morning. It is trading around $78,700 today.
Two weeks. Billions of dollars of institutional buying. The rally has gone absolutely nowhere.
Let us deal with that head on.
The Bid Did Not Break
August closed with $3.52 billion of net inflows into the US spot Bitcoin ETFs, the strongest month since September 2025. Only five of 21 sessions saw money leave. The week to 4 September added another $986.9 million, extending the streak to three weeks and roughly $3.8 billion, with BlackRock's IBIT taking $691.5 million of that week on its own.
Put it back into coin terms, the way we did it last time. $3.8 billion is somewhere near 48,000 BTC. Over those same three weeks the network mined around 9,450. So institutional buying absorbed roughly five times all new supply, and Bitcoin still cannot hold above $80,000 for more than a session.
Here is the part that gets lost. Flow data is a demand series. It tells you who is buying and how hard. It tells you nothing at all about who is on the other side, or how much coin is waiting at the price.
Three weeks of near record inflows that cannot clear resistance is not a failure. It is a measurement.
Three Attempts, Three Excuses
Since that note Bitcoin has run at $80,000 three separate times and been turned away every time.
On 28 August it printed $81,455, the high of the entire move, then fell away. The explanation offered was the $6.44 billion Deribit options expiry that same day.
On 4 September it reached $81,166 and failed again. That one was blamed on the August jobs report, which delivered 162,000 payrolls against much softer expectations. Yields rose, rate hike odds rose with them, and Bitcoin went back under $80,000.
On 8 September it had another go and could not hold it. Blamed this time on the fighting between the US and Iran, and oil pushing back toward $100.
Three attempts. Three completely different headlines. One identical outcome.
When a market gets rejected at the same price for three unrelated reasons, the reason is not the reason. The level is.
The Line That Explains The Year
For the rest of it you need the blockchain.
Source: https://charts.bgeometrics.com/sth_realized_price.html
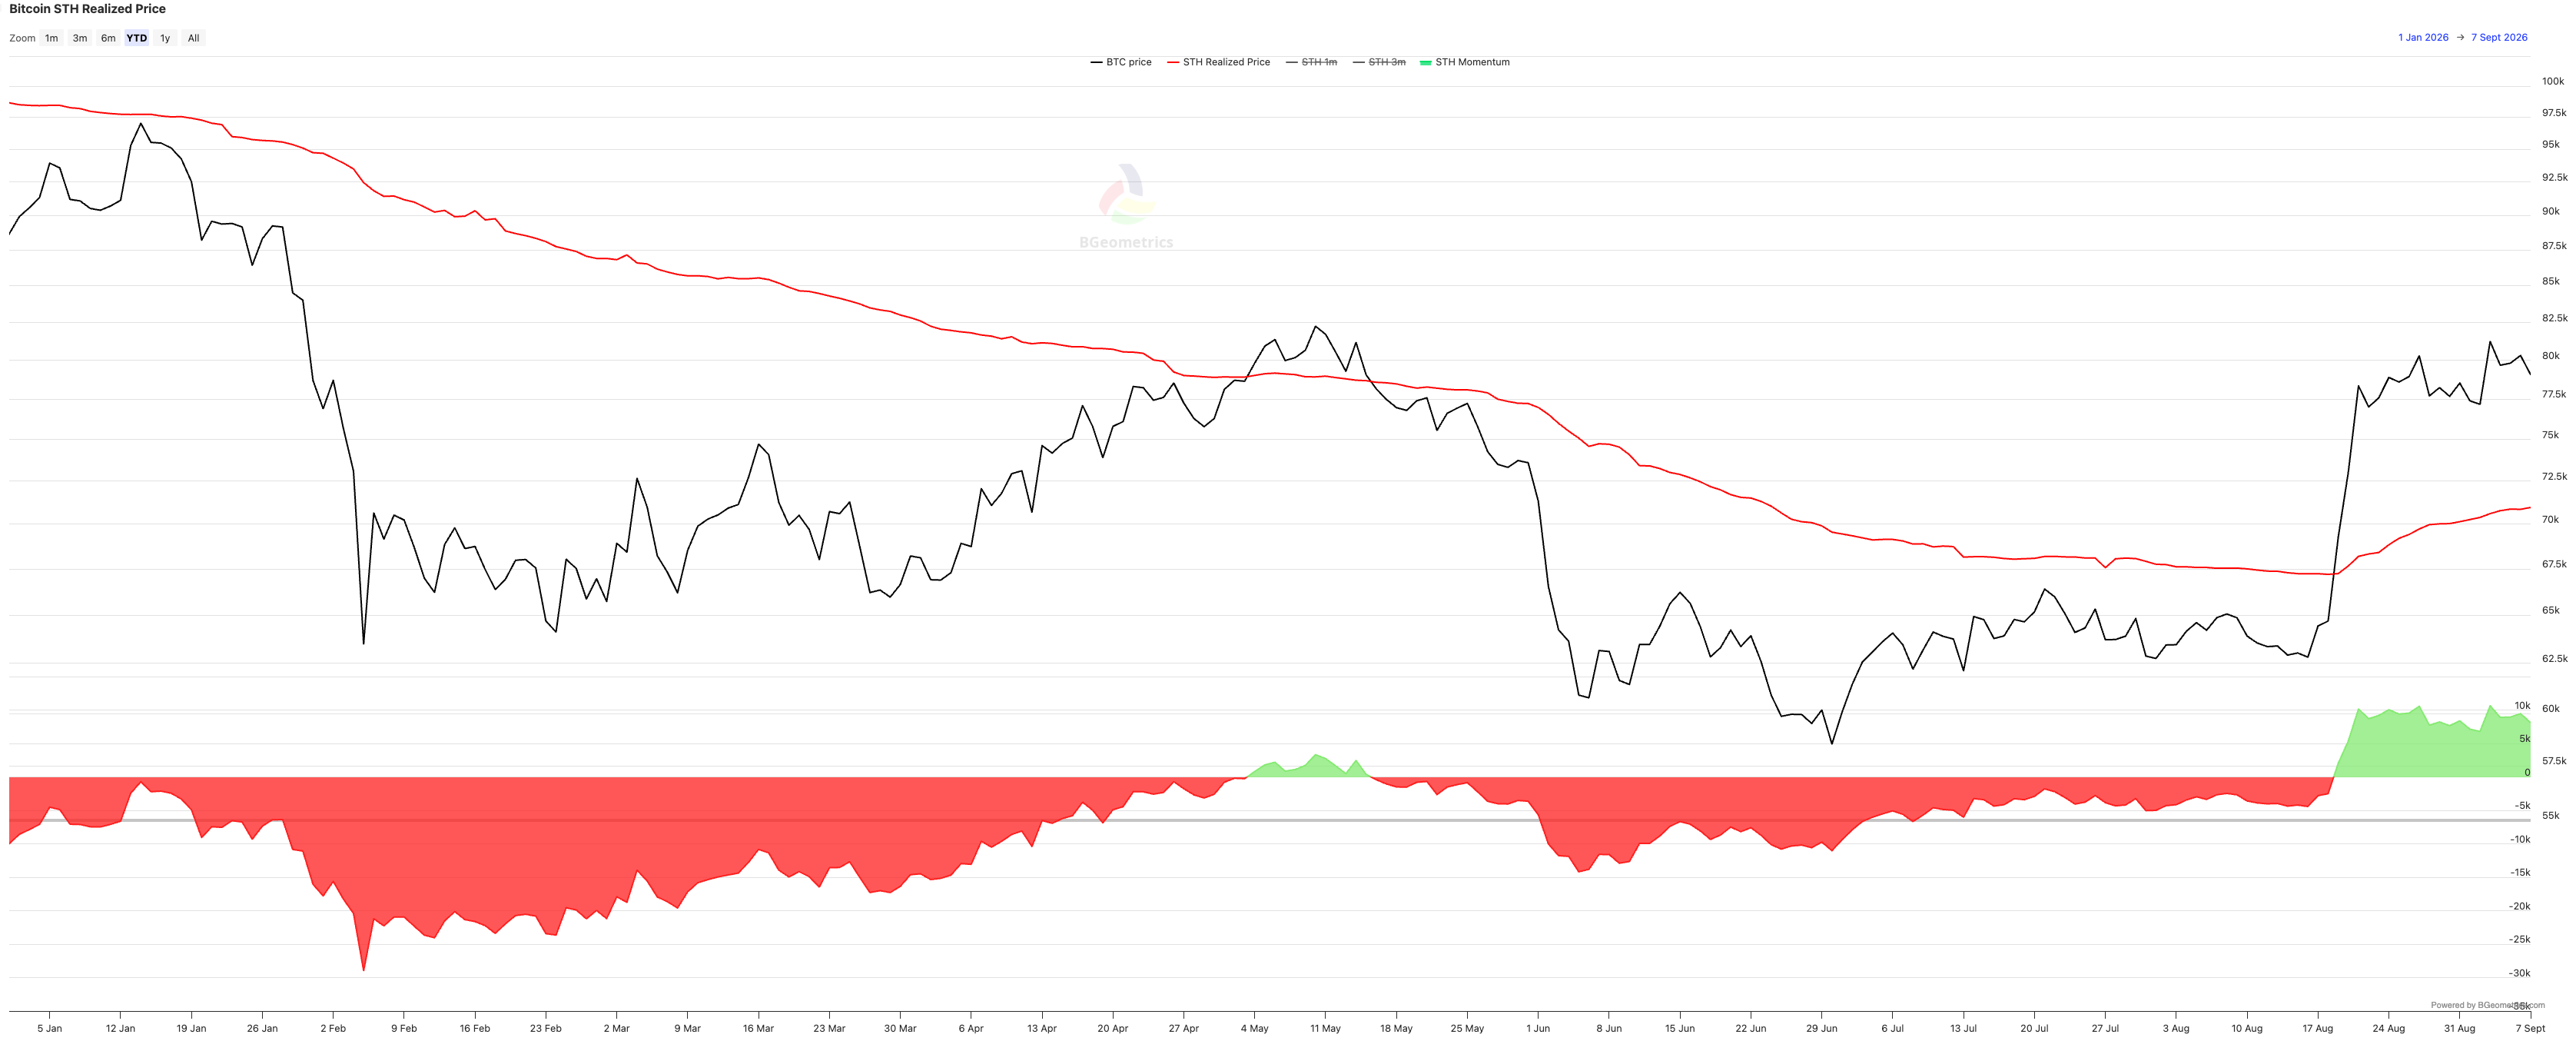
The red line is Short Term Holder Realised Price. It is the average price paid by everyone who has bought Bitcoin in the last 155 days. Think of it as the cost basis of the newest money in the market.
Start on the left. On 1 January it sat near $98,000. It then fell every week for seven straight months, down to roughly $67,000 by mid August.
And for nearly all of that stretch, the black price line sat underneath it.
That is the entire bear market in one picture. Every recent buyer, on average, underwater. There was one brief exception in May and it did not hold.
Now look at what happened from 17 August.
Price crossed back above the line and has stayed above it for three weeks. The momentum bars at the bottom flipped green and have stayed green, comfortably the longest stretch of the year. And the red line itself has turned upward for the first time in 2026.
That last part is the one to sit with. A rising short term holder cost basis means new coins are being bought at higher prices than the coins they replace. That does not happen in a market being distributed. It happens in a market being accumulated into.
The line now sits near $70,000 against a spot price of $78,700. The newest money in Bitcoin is roughly 12% in front.
One more thing worth pointing at on the same chart. Follow the black line from late August onward. The advance stops dead at $80,000 and goes flat for three weeks.
The reclaim was violent. The follow through was not. That flattening is the selling we described above, drawn out on a chart.
So Who Is Selling?
The chart above already answers it, if you put yourself in the seat.
Think about who has been buying Bitcoin since April. Most of them came in somewhere in the $60,000s. They sat underwater through the drawdown to $58,000 in late June, held through July, and then watched price run back to $80,000 in the space of three weeks.
That is not a hedge fund. That is somebody who has been in a losing position for months, is finally green, and is staring at a big round number.
They are not selling because they turned bearish. They are selling because they got their money back and $80,000 feels like a sensible place to stop worrying about it.
Then add a second group. Six wallets dormant since 2011 to 2014 moved 553 BTC during August, worth around $40 million. Completely different motivation, same effect on the tape.
And note what is absent from all of this. Open interest has been falling rather than building, and funding rates are moderate rather than stretched. Nobody is being liquidated. This is spot changing hands by choice.
So there is no whale dumping into this rally. What is happening is an orderly handover. Coins are moving from people who endured the 2026 drawdown and want out now that they are finally in front, and from a few very old holders taking something off after a decade, into the hands of allocators who are not remotely interested in a $2,000 range.
Handovers take time. That is why $3.8 billion can walk through the door and the price barely moves.
What Decides It From Here
Bitcoin is now sitting between two levels that matter, and neither of them is a moving average.
Above it, $80,000, where sellers have been waiting three times over.
Below it, around $70,000, the price its newest buyers paid and the line that has separated this year's bear market from everything since 17 August.
Neither of those is a forecast. Friday's CPI print and next week's Fed decision will do more to pick the direction than anything on the chart will.
But what the onchain data has already ruled out is worth holding onto. This is not a distribution top being built by exhausted holders, and it is not a leverage bubble looking for a pin. It is a slow transfer of coins from weak hands to patient ones, at a price that has not moved in a month.
Ranges like this are boring by design. They are also where positions get built.
Stormrake Spotlight: Pax Gold (PAXG) ($4,355)
Source: https://www.tradingview.com/x/MEixfuEw/
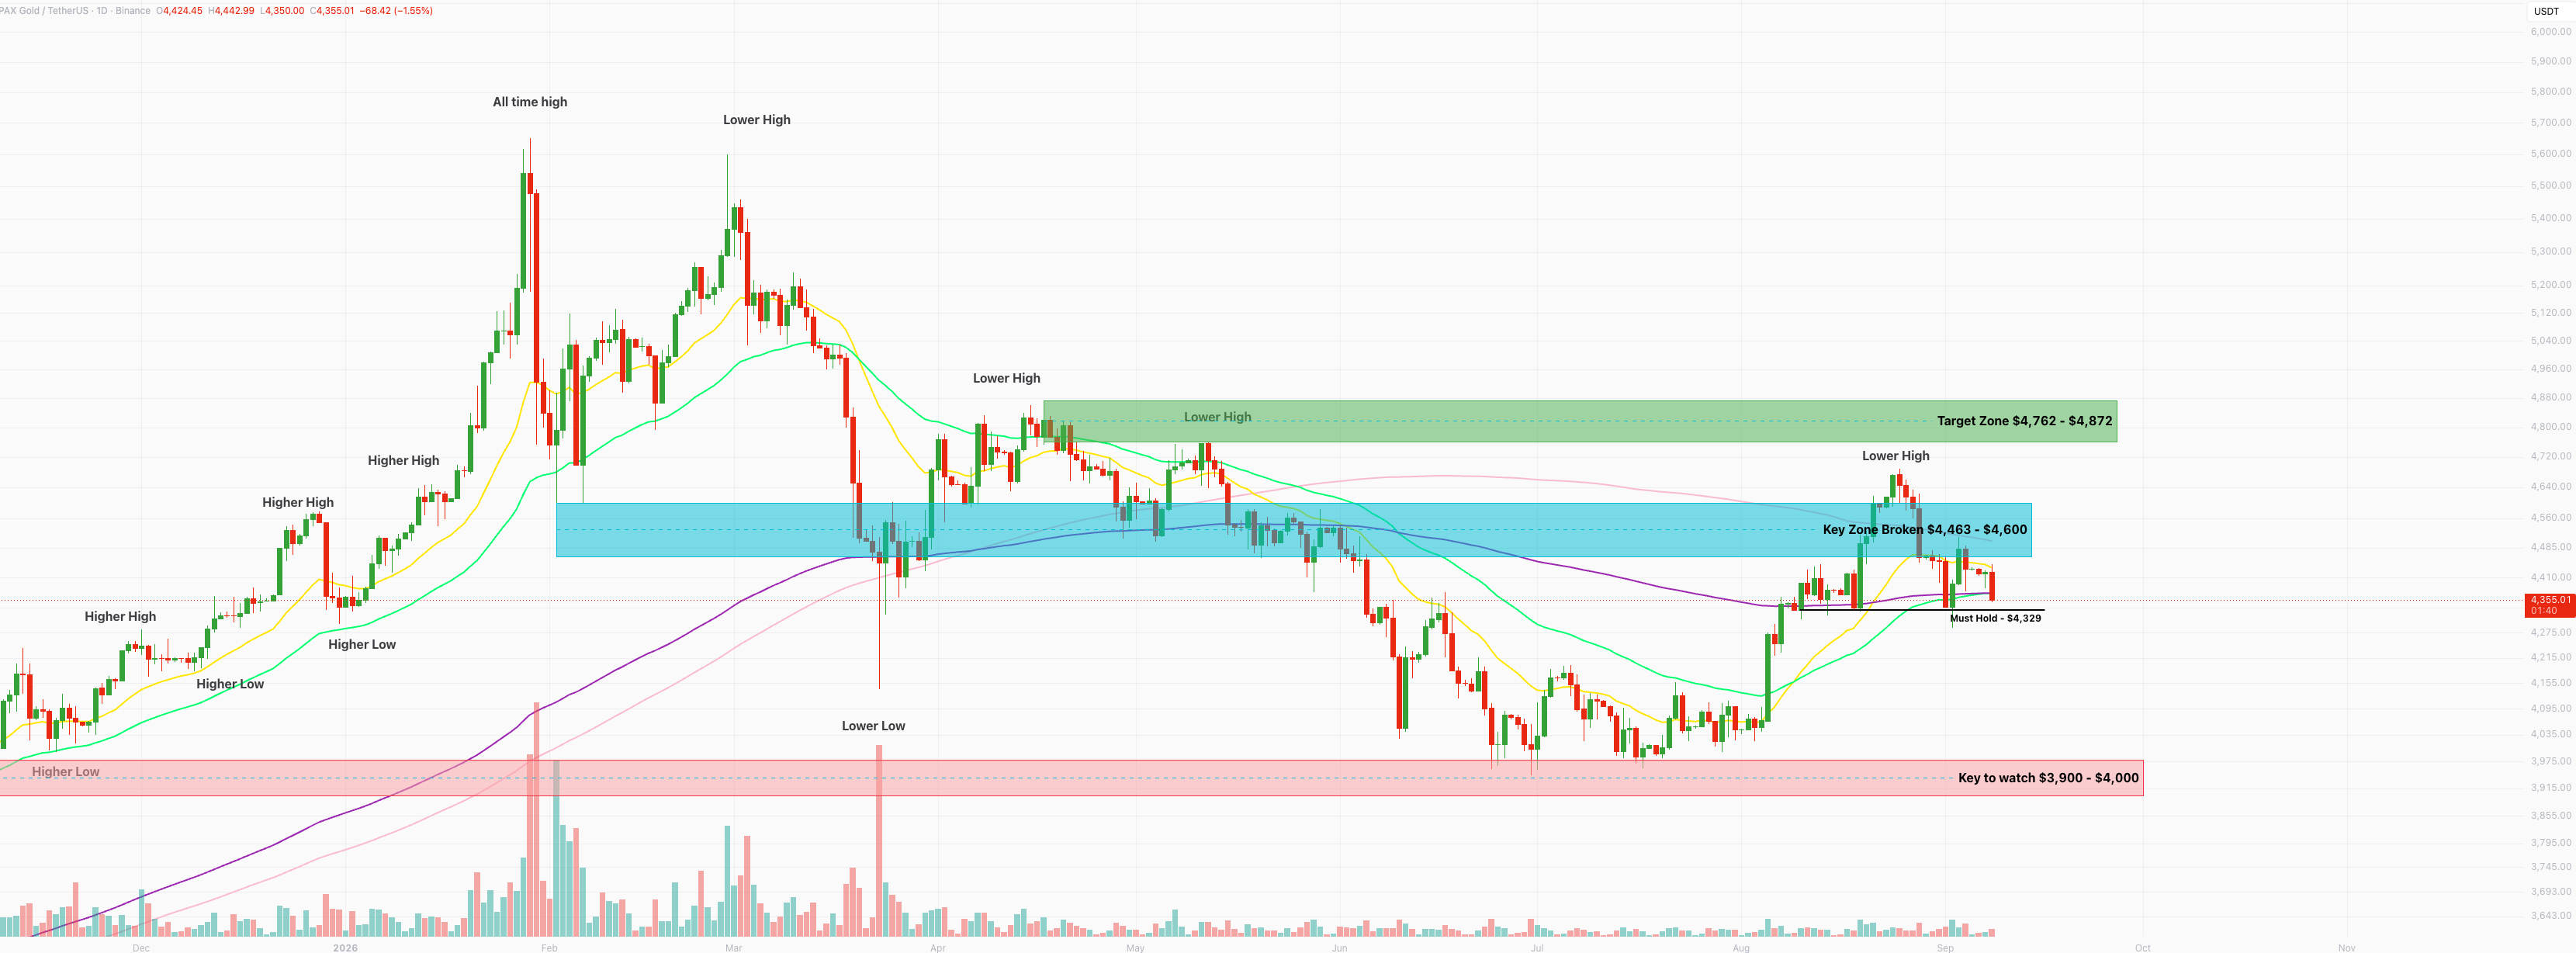
PAXG lost over 1.5% and is now back below all moving averages and looking to retest the must hold price of $4,329. If this is lost then the bears would be favoured to send PAXG lower once more…
BTC/USD Key Levels and Price Action:
Source: https://www.tradingview.com/x/AOh2rBqL/
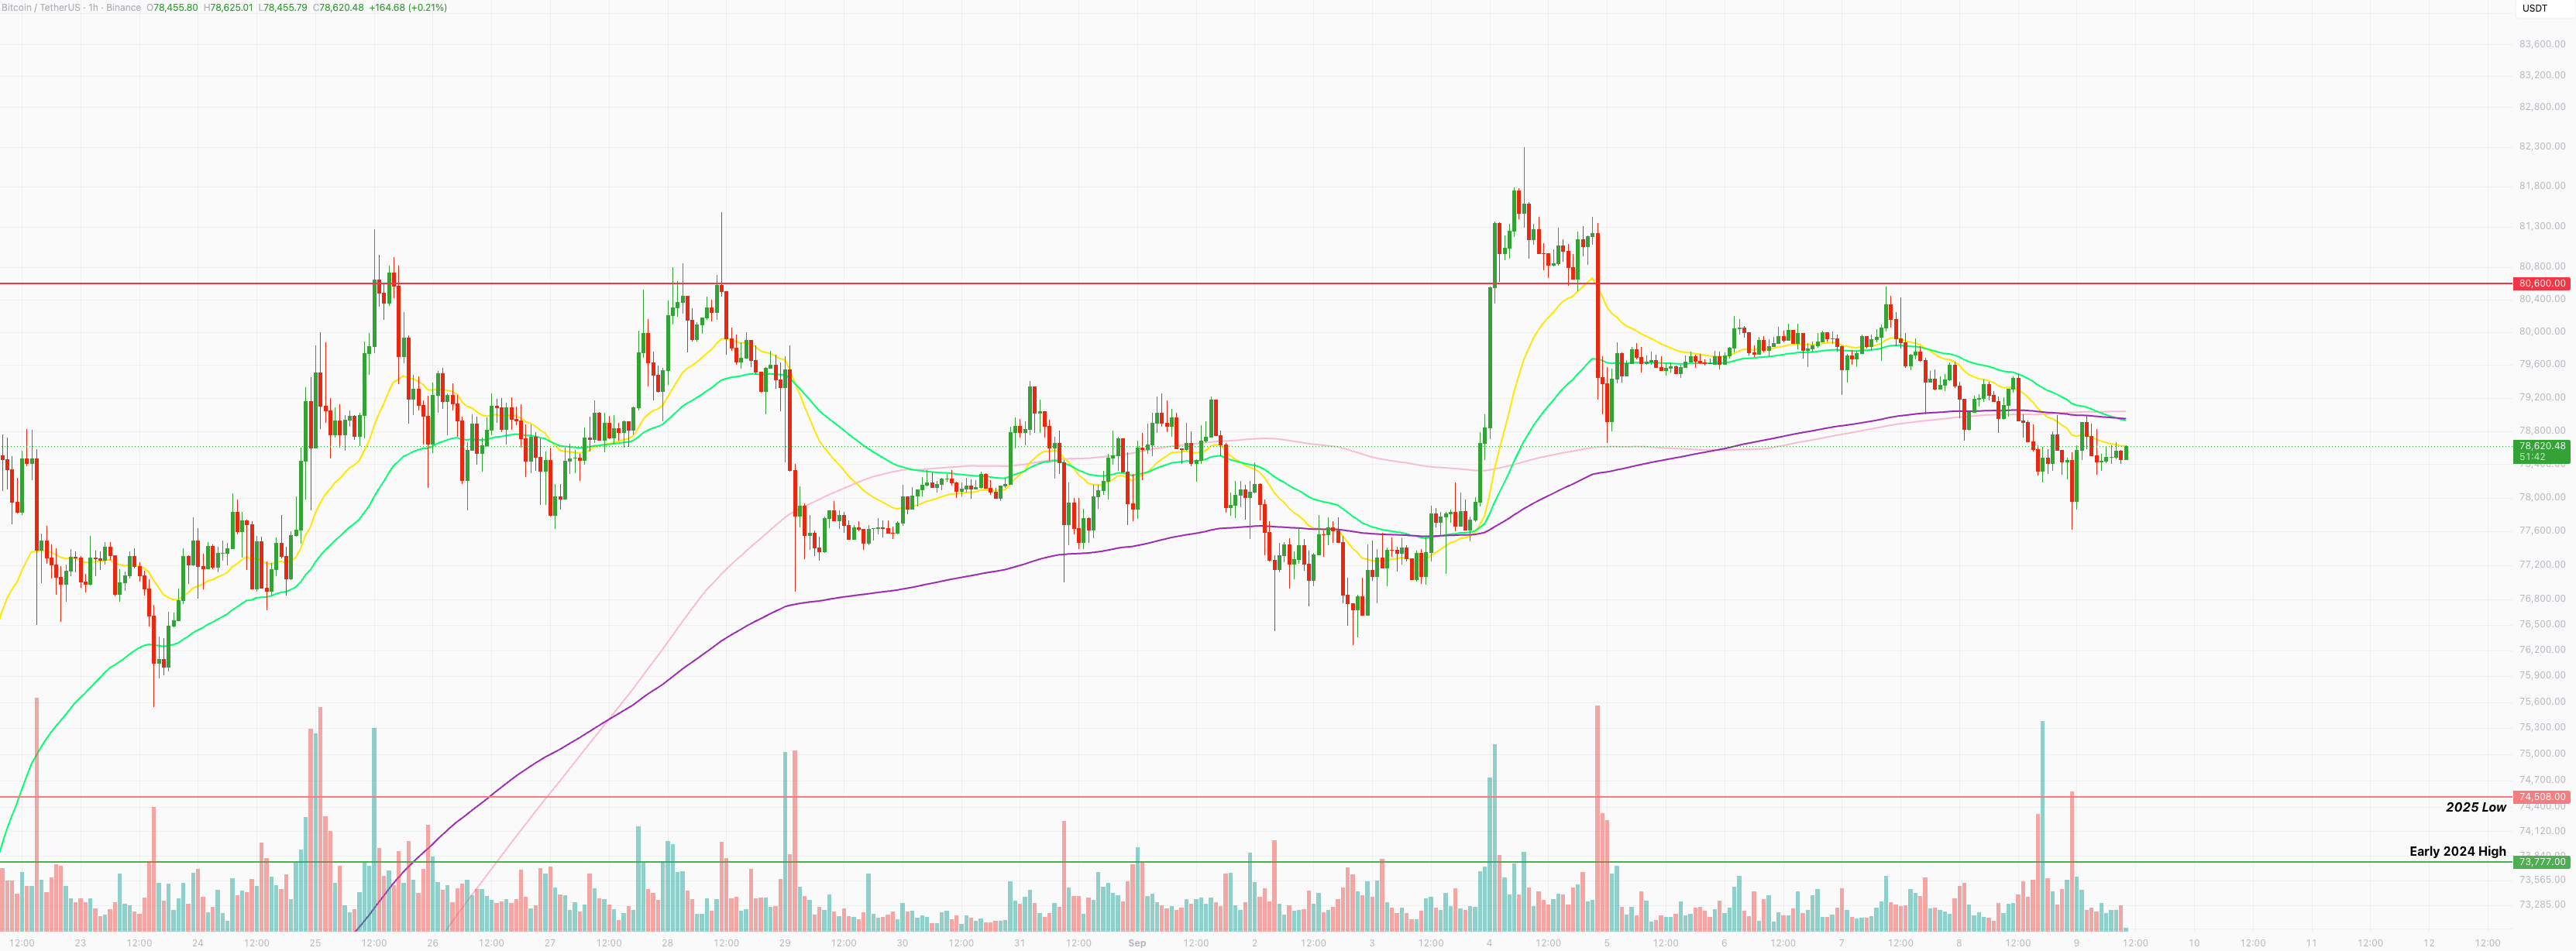
Two consecutive red days for Bitcoin as it lost nearly 1% and has seen the bears push price firmly below all moving averages. If the bears continue strong then this is the start of the pullback to the mid to low $70k region we have been expecting. Any of these pullbacks should be taken full advantage of before price continues higher…
All prices are denominated in USD unless stated otherwise
Written by Alexandar Artis
Create a brokerage account today
No Advice Warning
The information in this newsletter is general only. It should not be taken as constituting professional advice from the author - Stormrake PTY LTD.
Stormrake is not a financial adviser and does not provide financial product advice. You should consider seeking independent legal, financial, taxation or other advice to check how the information relates to your unique circumstances. Stormrake is not liable for any loss caused, whether due to negligence or otherwise arising from the use of, or reliance on, the information provided directly or indirectly, by this newsletter.
Disclaimer
All statements made in this newsletter are made in good faith and we believe they are accurate and reliable. Stormrake does not give any warranty as to the accuracy, reliability or completeness of information that is contained here, except insofar as any liability under statute cannot be excluded. Stormrake, its directors, employees and their representatives do not accept any liability for any error or omission in this newsletter or for any resulting loss or damage suffered by the recipient or any other person. Unless otherwise specified, copyright of information provided in this newsletter is owned by Stormrake. You may not alter or modify this information in any way, including the removal of this copyright notice.
Copyright © 2026 Stormrake Pty Ltd, All rights reserved