

The Man in the Mirror Looks Familiar
· Technical Analysis · Stormrake
- BTC
- ZEC

Look at Bitcoin’s chart today and 2023 looks back; right down to where the 200-day Moving Average sits
Bitcoin has spent the past few days pressing on its 200-day moving average, which sits near $73,100. A slide that began late on Sunday, as fresh turmoil in tech stocks and stalled US-Iran talks triggered more than $1bn of crypto liquidations, deepened after Tuesday’s hot US inflation data. Early on Wednesday morning, Australian time, Bitcoin dipped to a low of $72,727, its lowest level since August, briefly slipping below the line before buyers quickly pushed it back above.
Beneath the price action, adoption kept moving. On Wednesday, Deutsche Bank, Germany’s largest lender, said its digital asset custody service had gone live for paying institutional and corporate clients in Europe, covering Bitcoin, ether and select stablecoins. Banks build plumbing like this with a multi-year view, and they are building it into a pullback.
What the 200-Day Moving Average Tells Us
The 200-day moving average is the average closing price over roughly the past six and a half months. Above it, the long-term trend points up. Below it, the trend points down.
It also tends to switch roles. In a bear market it acts as a ceiling that rallies struggle to break. In a bull market it becomes a floor that pullbacks struggle to break.
From Ceiling in May to Floor in November
In May, with Bitcoin still in its bear market, the rally to about $82,300 stalled right at the 200-day average. The line held as a ceiling, and Bitcoin went on to set its cycle low of $57,800 a few weeks later.
In mid-August, the structure flipped. Bitcoin broke back above the 200-day for the first time since November 2025, and it has not traded below the line since 21 August.
This week’s slide is the first real test of the line from above. So far it has held, with daily lows stopping just above it.
We Have Seen This Setup Before
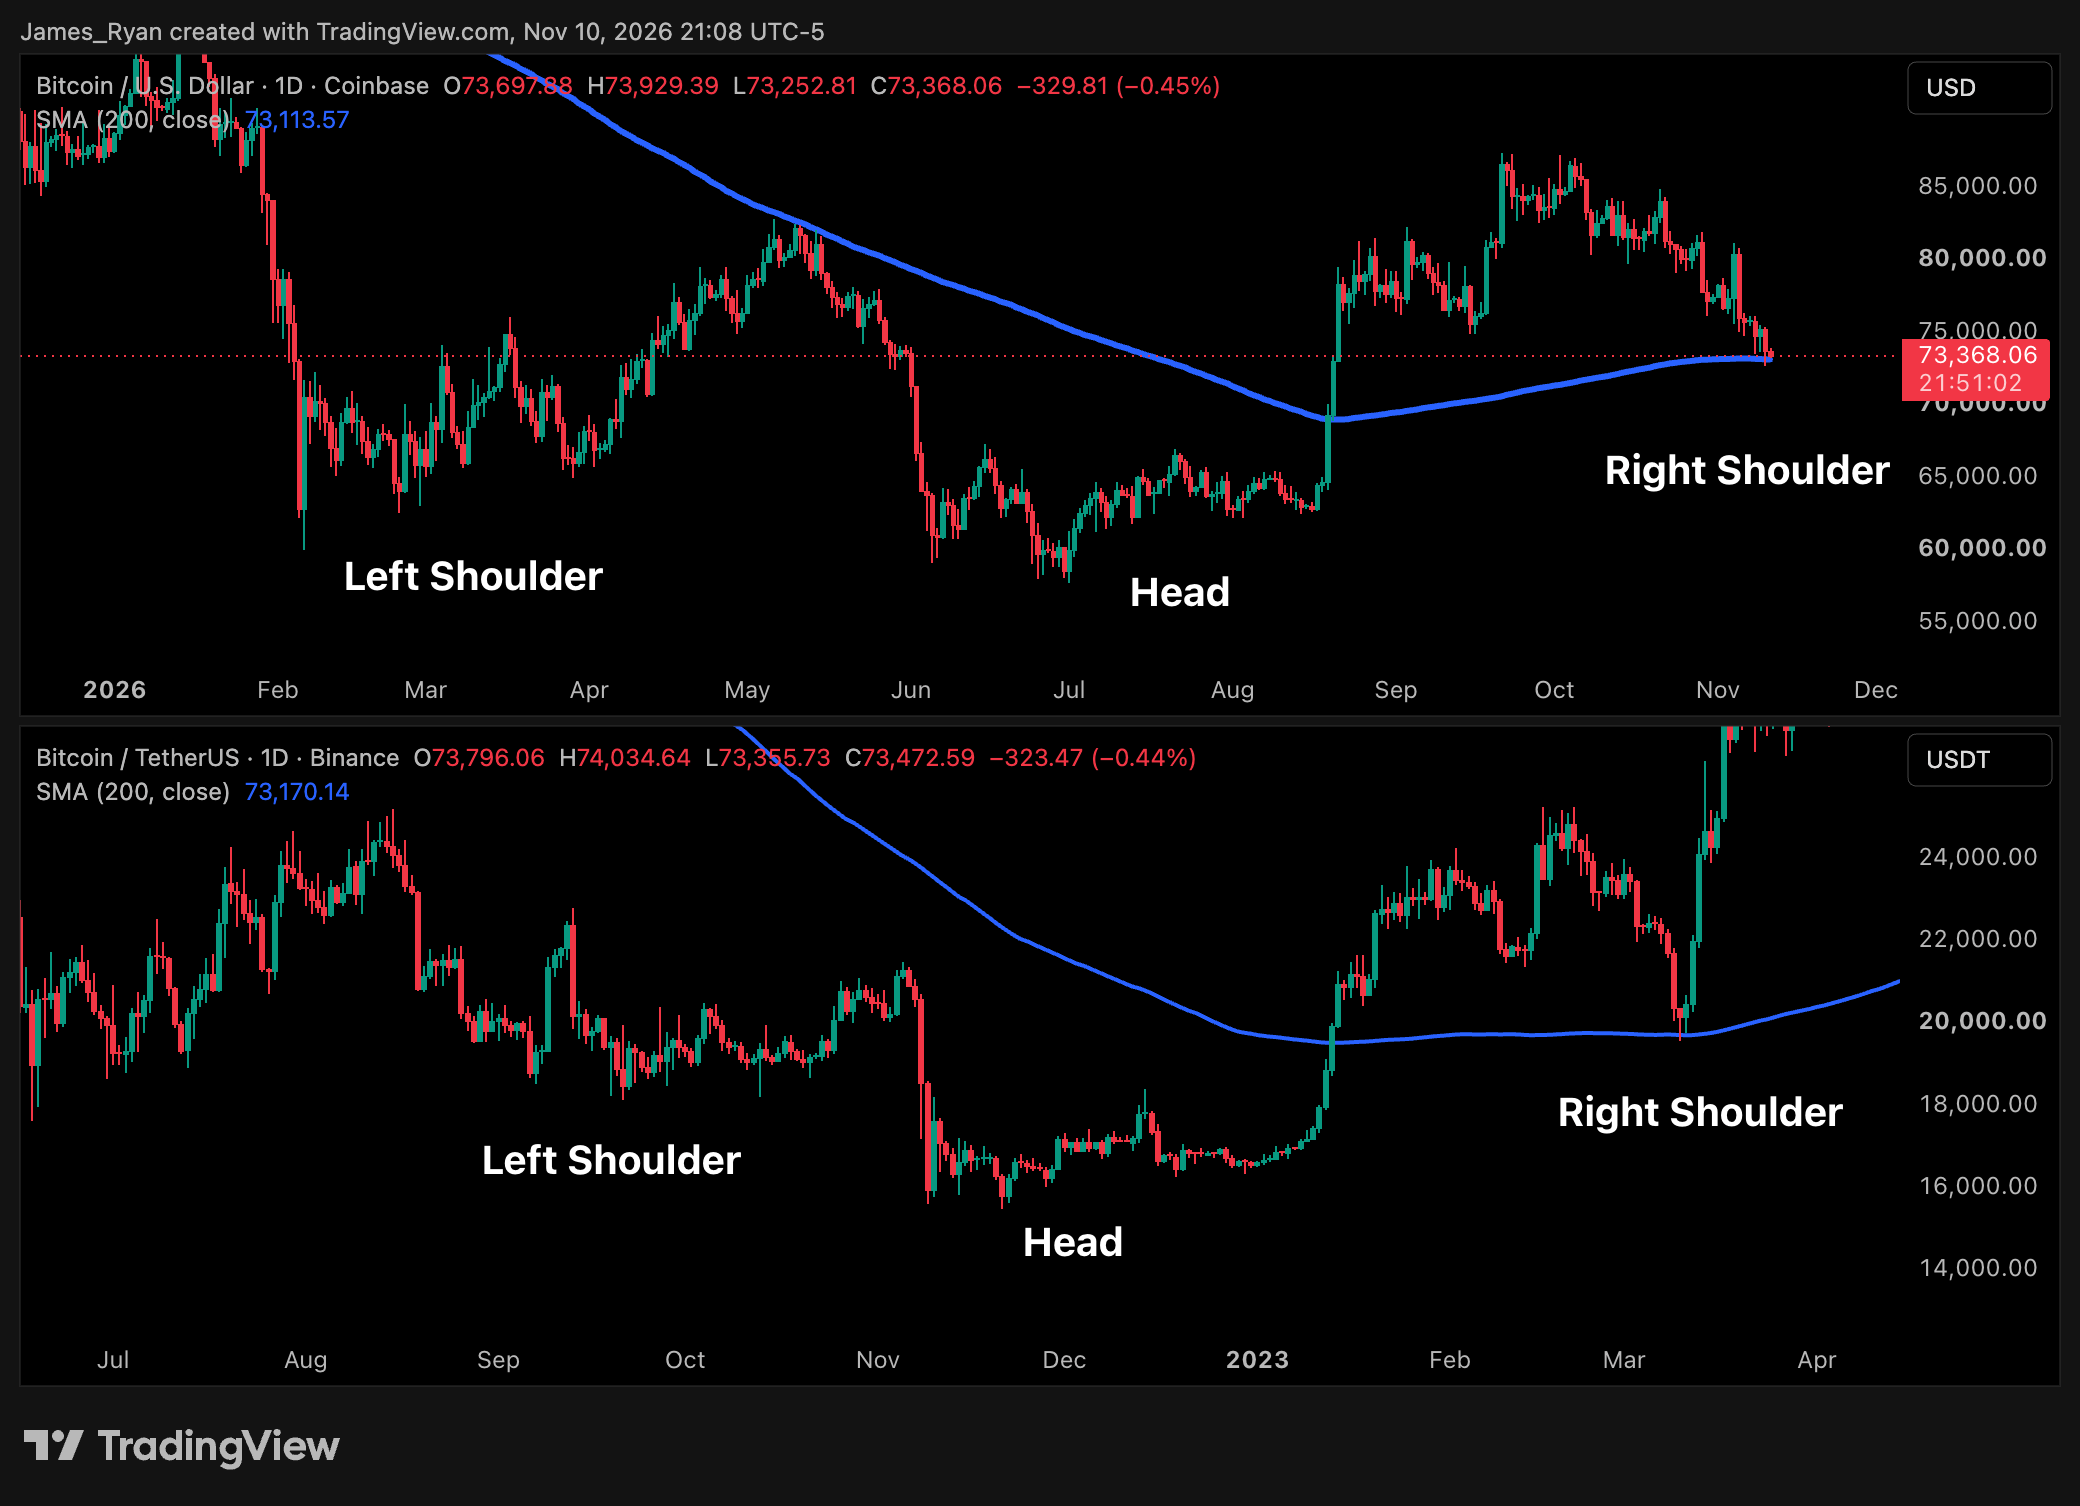
The same sequence played out at the start of the last bull run, in early 2023. Bitcoin broke above its 200-day average in January, coming off the FTX lows. Then in March, the Silicon Valley Bank scare sent it below its previous lows in a fast liquidation cascade that ran straight into the 200-day, near $19,600.
That dip marked the turn. Four days later Bitcoin was above $26,000, and by mid-April it traded near $31,000, a V-shaped reversal of almost 60% from the low. Bitcoin has not traded as low as $19,600 since.
Source: https://www.tradingview.com/x/HjTHPIO8/
Put the two cycles side by side and they trace the same shape, one pattern we’ve mentioned previously is an inverse head and shoulders: a first low (the left shoulder), a deeper low (the head), then a higher low (the right shoulder). In the last cycle, the head was the FTX low near $15,500, and the right shoulder formed right on the 200-day average in March 2023. This cycle, the left shoulder is February’s low near $60,000 and the head is the $57,800 low from late June. The right shoulder is forming now, on the same line.
As we discussed in recent notes, this cycle has tracked early 2023 closely: a breakout, a higher low, then a sweep below support. This time the full pullback from the October high of $87,400 has been about 16%, against more than 20% in 2023. The cascade has now carried price to the same line that marked the 2023 turn.
Under the Hood of a Hot CPI Print
As we covered yesterday, October’s inflation data came in hotter than expected. The detail was kinder than the headline. Monthly inflation cooled from 0.6% in September, and energy’s 0.7% rise reflects October’s high oil prices, before Brent’s slide since late October. Bloomberg Economics also noted that core goods prices fell meaningfully, led by car price cuts, and that AI-driven price pressure in electronics appears to have peaked.
Markets have now priced out any chance of a December hold. Bitcoin’s dip to its lowest level since August came as that repricing landed, and the 200-day still held.
What We Are Watching
Daily closes above the 200-day, near $73,100. This is the line that separates a pullback within an uptrend from something deeper. Holding it keeps the 2023 comparison on track.
The 100-day average, near $77,400. A move back above it would be the first sign the bounce is turning into a trend again.
ETF flows. US spot Bitcoin ETFs saw $1.28bn of outflows last week, their worst week since June. A return to inflows would confirm buyers are back.
In May, the 200-day average marked the top of a bear-market rally. This week, it is holding the same line as the floor in an early bull-market pullback.
Stormrake Spotlight: Zcash (ZEC) ($969)
Source: https://www.tradingview.com/x/WhyQGH4g/
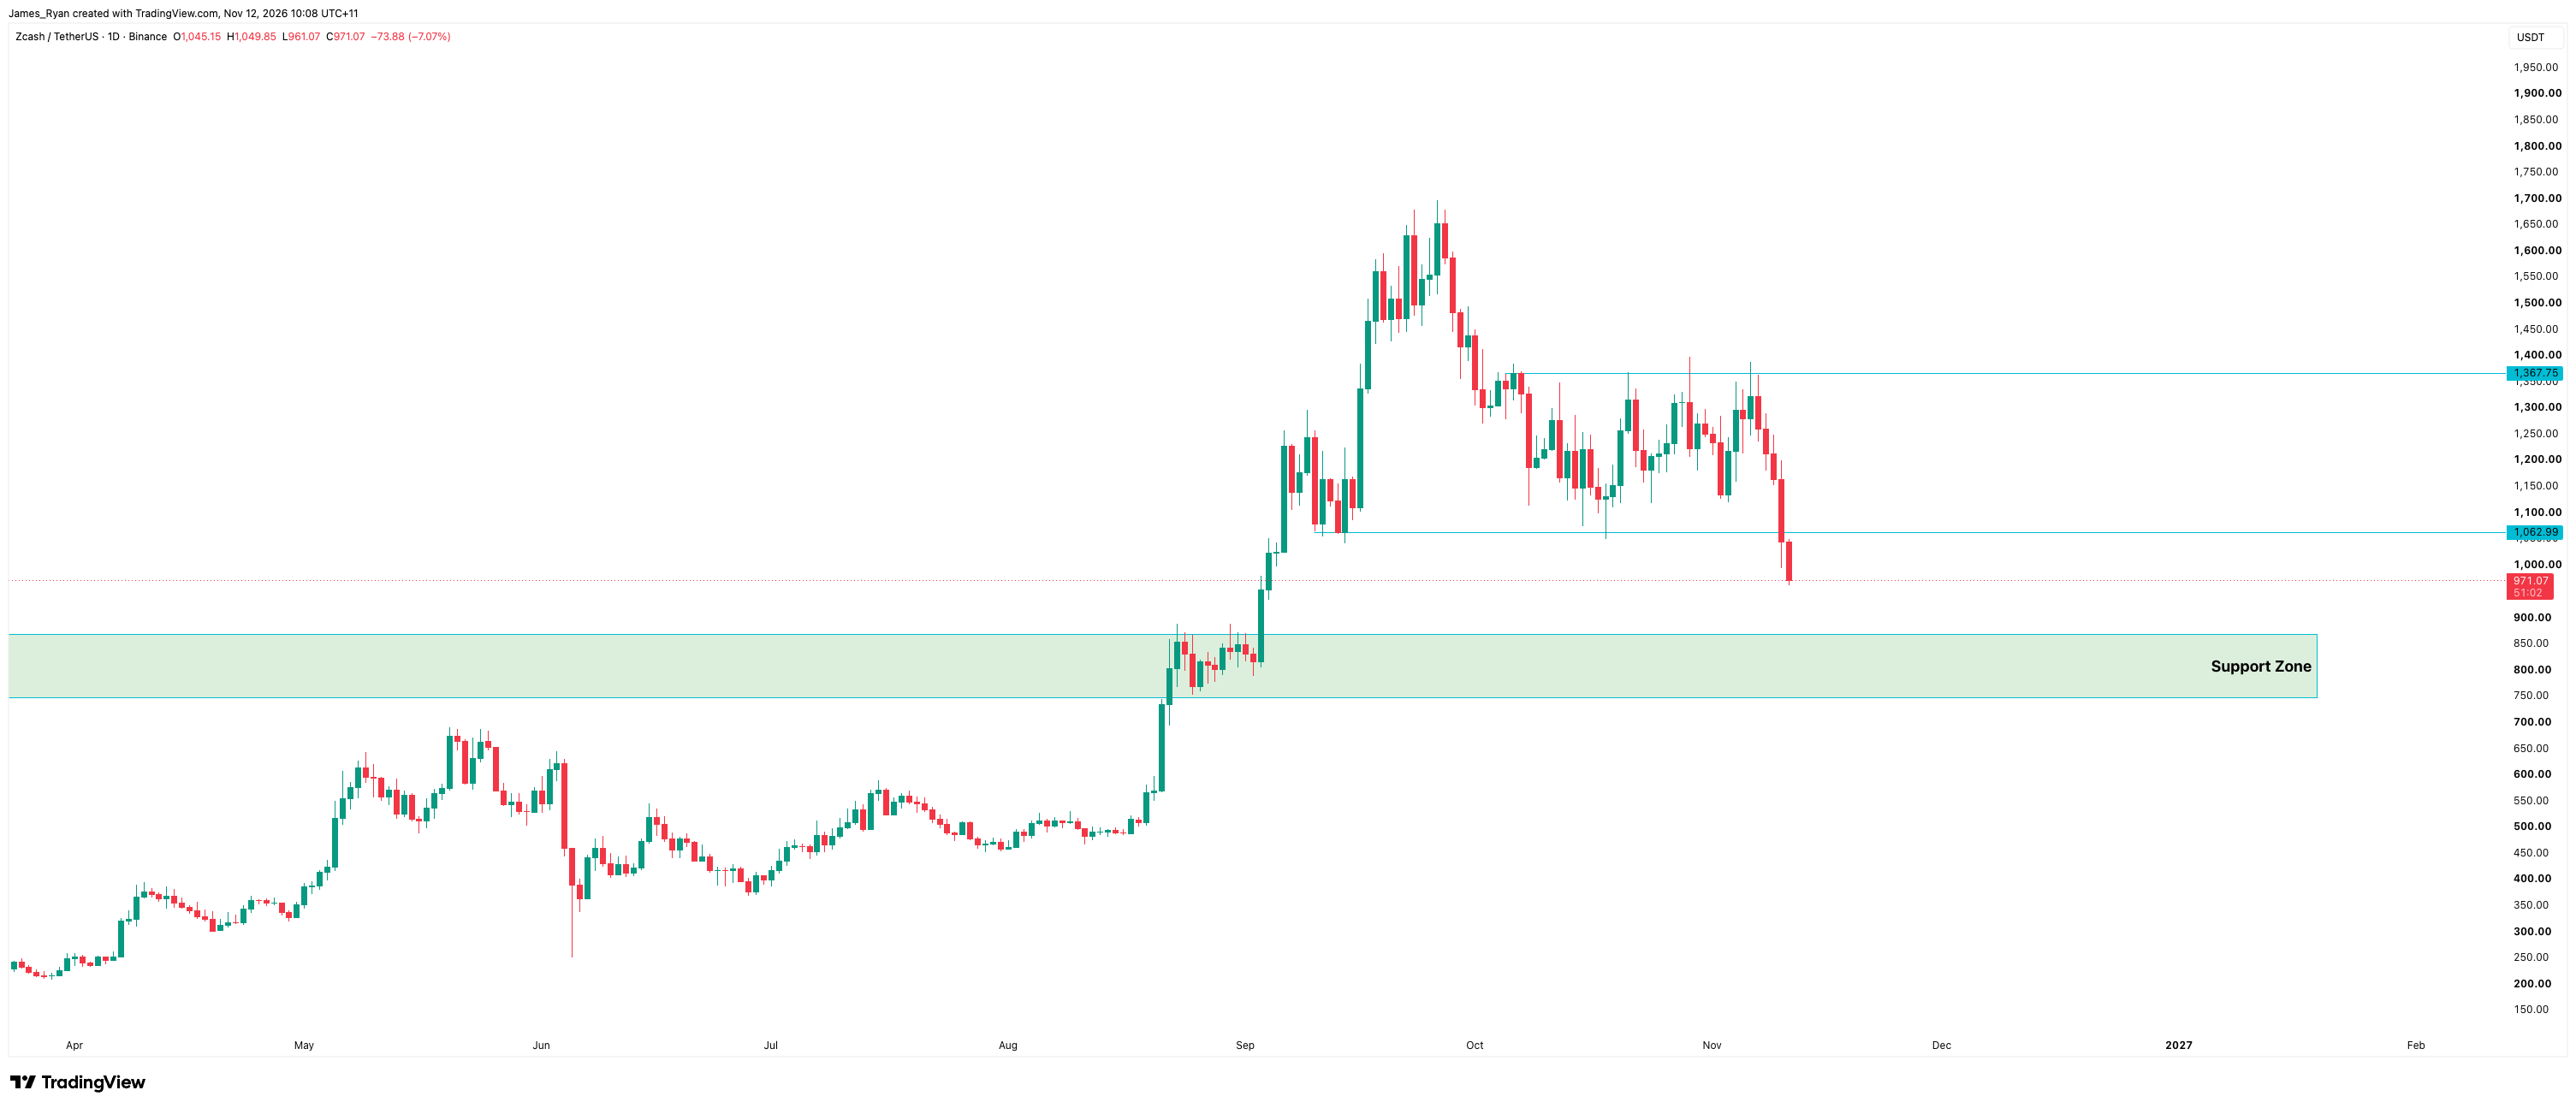
ZEC has broken below the bottom of the consolidation channel it has held since September, losing the $1,063 floor and falling more than 7% today to trade below $1,000. With the range lost, the next major level is the support zone between $750 and $865, the base ZEC built in late August before its breakout. A retest of this zone now looks likely, and how buyers respond there will decide whether ZEC finds a floor or extends lower. Reclaiming $1,063 would be the first sign of strength.
BTC/USD Key Levels and Price Action:
Source: https://www.tradingview.com/x/yfJne5uS/
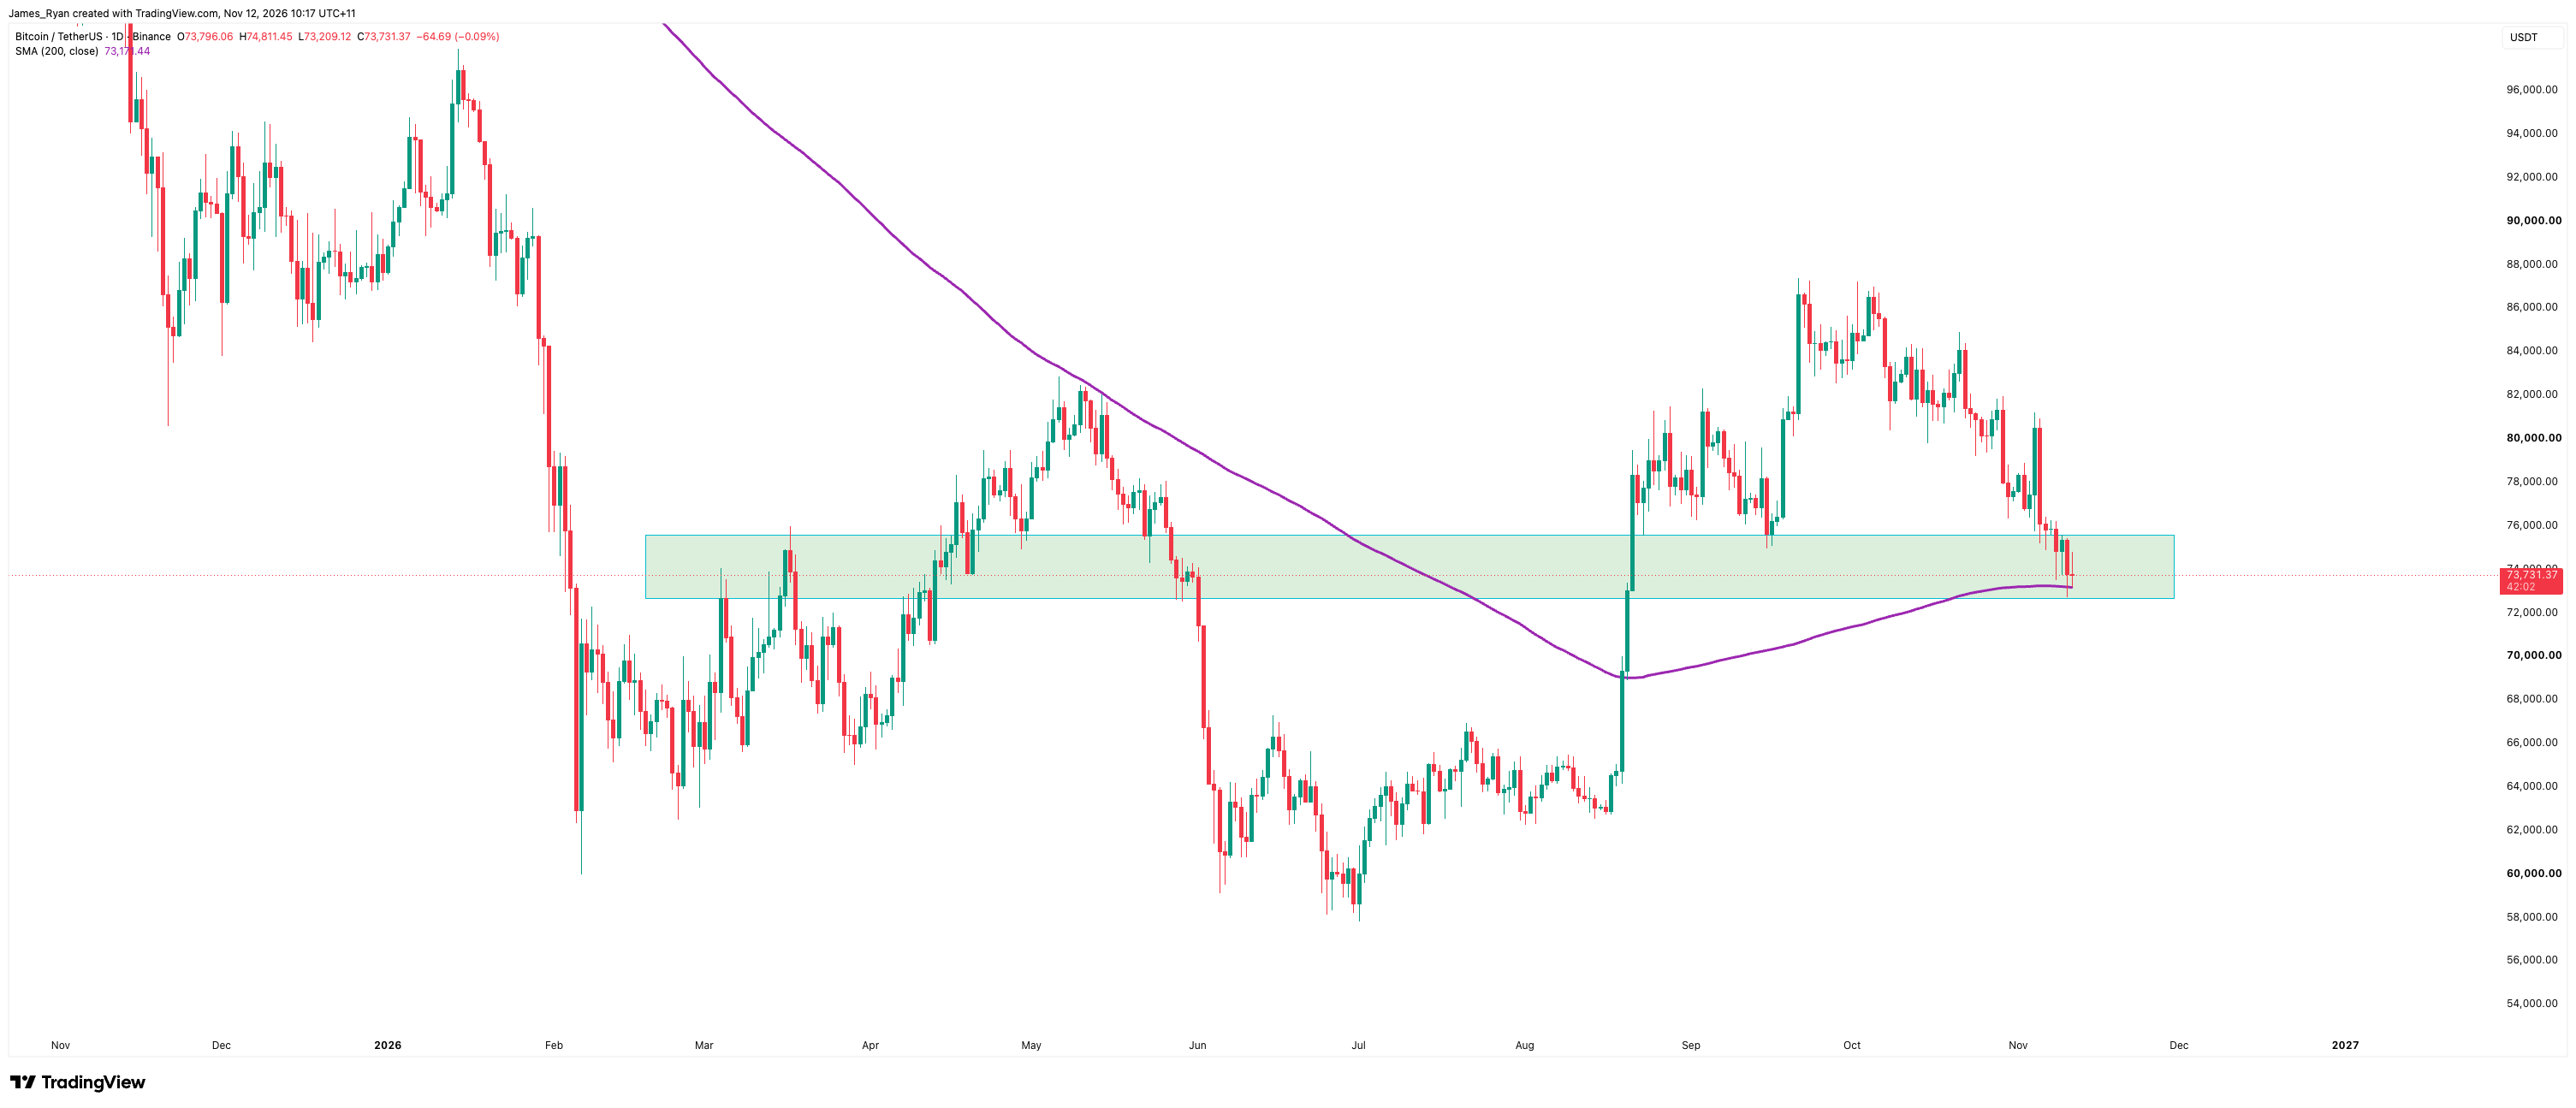
Bitcoin is holding the line. Despite another wave of negative headlines, price has found support at the 200 daily moving average, now sitting near $73.2k, after dipping to $72.7k yesterday and bouncing straight back above it.
The backdrop hasn't been kind. MSCI confirmed overnight that Strategy (MSTR) will be removed from its MSCI USA Index on 30 November, with JPMorgan estimating up to $2.8 billion in forced selling of the stock. Nvidia also slid more than 8% after hours on a fresh report about CEO Jensen Huang. Bitcoin has absorbed both without losing its footing.
The 200 daily moving average sits inside the green support zone between roughly $72.7k and $75.7k, an area that has been pivotal all year. This is where we expect a higher low to form on the macro structure, well above the $57.8k cycle low.
As long as price holds this zone on a daily closing basis, the higher timeframe uptrend remains intact. A daily close below $72.7k would put that structure at risk and open the door to a deeper retracement.
*All prices are denominated in USD unless stated otherwise*
Written by James Ryan