To receive the Morning Note in your inbox, subscribe here: https://stormrake.substack.com/

Bitcoin closed August up 25%, its largest monthly gain since November 2024. Price ran from the low $60,000s to a high of $81,455 before settling at $78,500.
Resistance broken, structure flipped, the bear market comprehensively over. The bulls did not simply win August, they took the chart off the bears entirely.
That was meant to be the difficult part. August has been one of only two months with a negative average return across Bitcoin’s history. The bears leaned on that fact all month and got run over.
Now the calendar flips and the same argument gets recycled. September is Bitcoin’s worst month on record, averaging -4.86% with only six green closes out of fifteen. You will see that stat everywhere this week.
Here is what tends to get left out.
Look At Which Six
September has closed green three years running. Up 3.99% in 2023, 7.39% in 2024 and 5.16% in 2025, the last of those the third best September on record.
The seasonal weakness everyone quotes is concentrated in years that look nothing like this one. The worst September on the board, 2019 at -13.88%, came in the middle of a post-blowoff grind. The rest of the red prints cluster in bear markets and leverage unwinds.
That matters because seasonality is a description, not a mechanism. There is nothing about the month of September that makes Bitcoin fall. What made Bitcoin fall in those years was leverage, macro and market structure. All three have flipped into the bulls’ hands over the past four weeks, and none of them takes instruction from the calendar.
Run The Numbers Anyway
Say the doubters are right. Say Bitcoin delivers exactly its historical September average and hands back 4.86%.
That puts price at roughly $74,700. Which is a level we have been talking about for weeks.
A pullback of that size is exactly what we have described as healthy and constructive after a run like August’s. The reason is where it lands. The $74,000 to $75,000 band is the 2025 low, it is where price found a floor again in February this year, and it sits just above the April 2024 peak. That is the zone where the last cycle’s high turned into this cycle’s support.
So the seasonal average and our own technical map are pointing at the same place. That is not a warning, it is confirmation. If Bitcoin does precisely what September historically does, it does precisely what we would want it to do anyway.
It would also still leave price comfortably above July’s $62,814 close. The bulls stay in control, the breakout structure stays intact, and the bear market stays comprehensively over.
A red September at the historical average would not be the top everyone will tell you it is. It would be a pullback into support inside an uptrend, and a welcome one.
What We Are Watching
Our target for September is for Bitcoin to break the lower high at $83,000, the same level we set as bear market invalidation. Take that out and Bitcoin clears the bulk of the overhead resistance sitting between here and the low $90,000s, and the doubters run out of arguments. If we get the pullback instead, we would expect further accumulation through the $70,000s.
The flows support the case. US spot Bitcoin ETFs took in more than $3 billion across August, comfortably their strongest month of 2026 and roughly double April’s previous high of $1.97 billion. That run cut the year’s net outflows by more than half and lifted total net assets to just under $100 billion. This was not a rally on thin air.
Bitcoin takes its direction from momentum, flows, leverage and structure. It has never once checked the date.
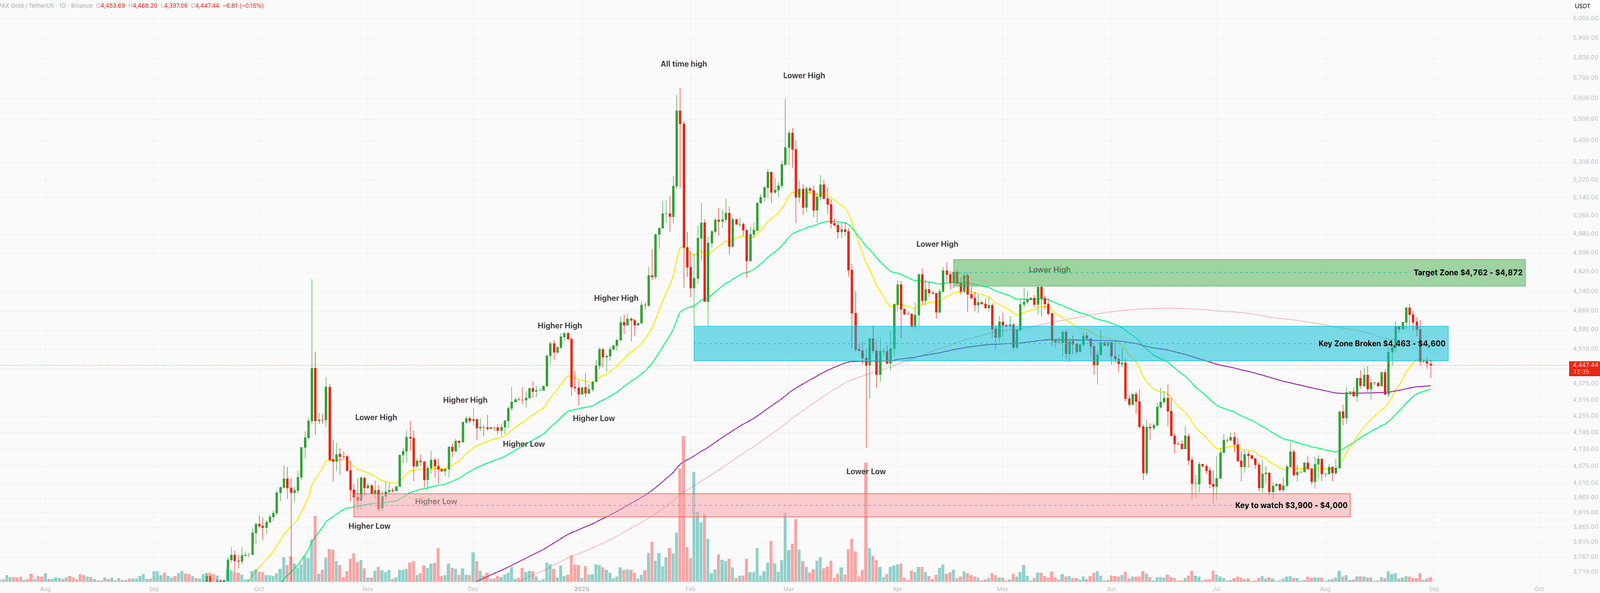
Stormrake Spotlight: Pax Gold (PAXG) ($4,446)
Stormrake Spotlight: Pax Gold (PAXG) ($4,446)