ISM Breakout Signals a Bullish Shift for Bitcoin

04 Feb 2026 01:37 PM By Stormrake

To receive the Morning Note in your inbox, subscribe here: https://stormrake.substack.com/
When it comes to macro data, Bitcoin is not always directly affected. However, there are a handful of releases that consistently influence price action, with inflation data being the most widely followed. That said, studies and historical analysis show that Bitcoin has displayed its strongest correlation with the US ISM Manufacturing PMI.

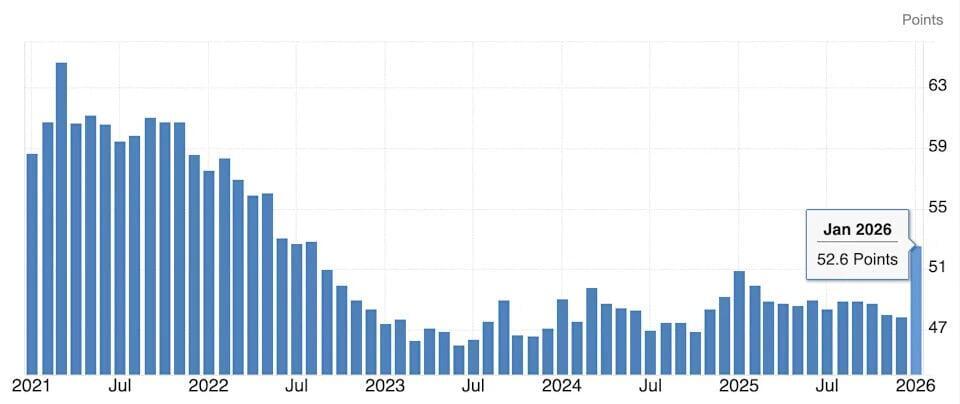
The ISM Manufacturing PMI is a monthly economic indicator that measures the health of the US manufacturing sector. A reading above 50 signals expansion, while a reading below 50 indicates contraction.
So how does this relate to Bitcoin? Most importantly, we have just seen the first monthly ISM reading above 50 in several years. The index was forecast at 48.5, yet the actual print came in at 52.6, a notable upside surprise and a traditionally bullish signal.

This shift has injected fresh optimism into what has largely been a bearish macro backdrop. Historically, sustained breakouts in the ISM above 50 have coincided with the early stages of major Bitcoin bull runs, most notably in 2013, 2016, and 2020.
As shown in the chart above, when the ISM, displayed in the lower panel, moves into an expansionary phase after an extended period below 50, it has historically preceded the most aggressive of Bitcoin bull markets. In the current cycle, the ISM has just crossed back above 50 after spending roughly 26 months in contraction. While the ISM chart data has not yet fully updated, the signal itself is significant.

Historically, Bitcoin bull market peaks have occurred no sooner than 11 months after a sustained ISM breakout above 50. In the 2020 cycle, the peak arrived closer to 20 months later. If we see another one or two months of expansionary ISM readings, the clock effectively starts for a potential multi month bull run, with the possibility of new all time highs further down the line.

It is also worth addressing the current cycle. Yes, Bitcoin did experience a rally while the ISM remained in contraction, but it lacked the classic blow off top seen in prior cycles. The persistent contractionary macro backdrop may have played a role in capping upside momentum. As always, this is just one indicator and not the sole driver of Bitcoin price action.

The silver lining is that Bitcoin managed to print a new all time high while the ISM was still in contraction. Now, with a potential shift back into expansion, the broader signal suggests we are much closer to a macro bottom than a top. This aligns with what we have been signalling over the past month, however we have also been cautious that price has been at a real threat of moving lower, which has been the case.

Many indicators are sitting at historical extremes and point towards a bottoming process, although price action suggests it is not fully confirmed yet. This is why disciplined allocation and gradual accumulation remain key. Contact your Stormrake Broker to stay ahead with smart allocations.

Stormrake Spotlight: Pax Gold (PAXG) ($4,963)

PAXG has not only created a higher low, which is crucial for the bulls, but has also bounced more than 10% from that low over the past day. Bullish momentum and structure remain intact. The real test now is the all time high. PAXG needs to make another push towards this level, as failure to do so would result in a lower high, which would be a negative technical signal.

BTC/USD Key Levels and Price Action:

Another bearish session for Bitcoin, with price once again failing to reclaim the 55 EMA. This continues to signal a strong downtrend, while Bitcoin has also printed a fresh lower low at $73K. The positive takeaway for bulls is the presence of major support in this region. This level marks Bitcoin’s previous all time high and acted as a key consolidation zone throughout much of 2024.

If we fail to see a sustained bounce from this area, downside risk remains strong, with the $60Ks region likely coming back into play.

BTC Total ETF Flows for 3 Feb: (data not available at the time of writing)

(ETF flow data is sourced from https://farside.co.uk/btc/ and reflects figures at the time of writing.)
To receive the Morning Note in your inbox, subscribe here: https://stormrake.substack.com/

*All prices are denominated in USD unless stated otherwise*

Written by Alexandar Artis and James Ryan

Create a brokerage account today

No Advice Warning 

The information in this newsletter is general only. It should not be taken as constituting professional advice from the author - Stormrake PTY LTD.
Stormrake is not a financial adviser and does not provide financial product advice. You should consider seeking independent legal, financial, taxation or other advice to check how the information relates to your unique circumstances. Stormrake is not liable for any loss caused, whether due to negligence or otherwise arising from the use of, or reliance on, the information provided directly or indirectly, by this newsletter.
 

Disclaimer 

All statements made in this newsletter are made in good faith and we believe they are accurate and reliable. Stormrake does not give any warranty as to the accuracy, reliability or completeness of information that is contained here, except insofar as any liability under statute cannot be excluded. Stormrake, its directors, employees and their representatives do not accept any liability for any error or omission in this newsletter or for any resulting loss or damage suffered by the recipient or any other person. Unless otherwise specified, copyright of information provided in this newsletter is owned by Stormrake. You may not alter or modify this information in any way, including the removal of this copyright notice.

Copyright © 2024 Stormrake Pty Ltd, All rights reserved

Stormrake