What Is “Cost of Production” and Why Does It Matter?
Checking Two Different Sources
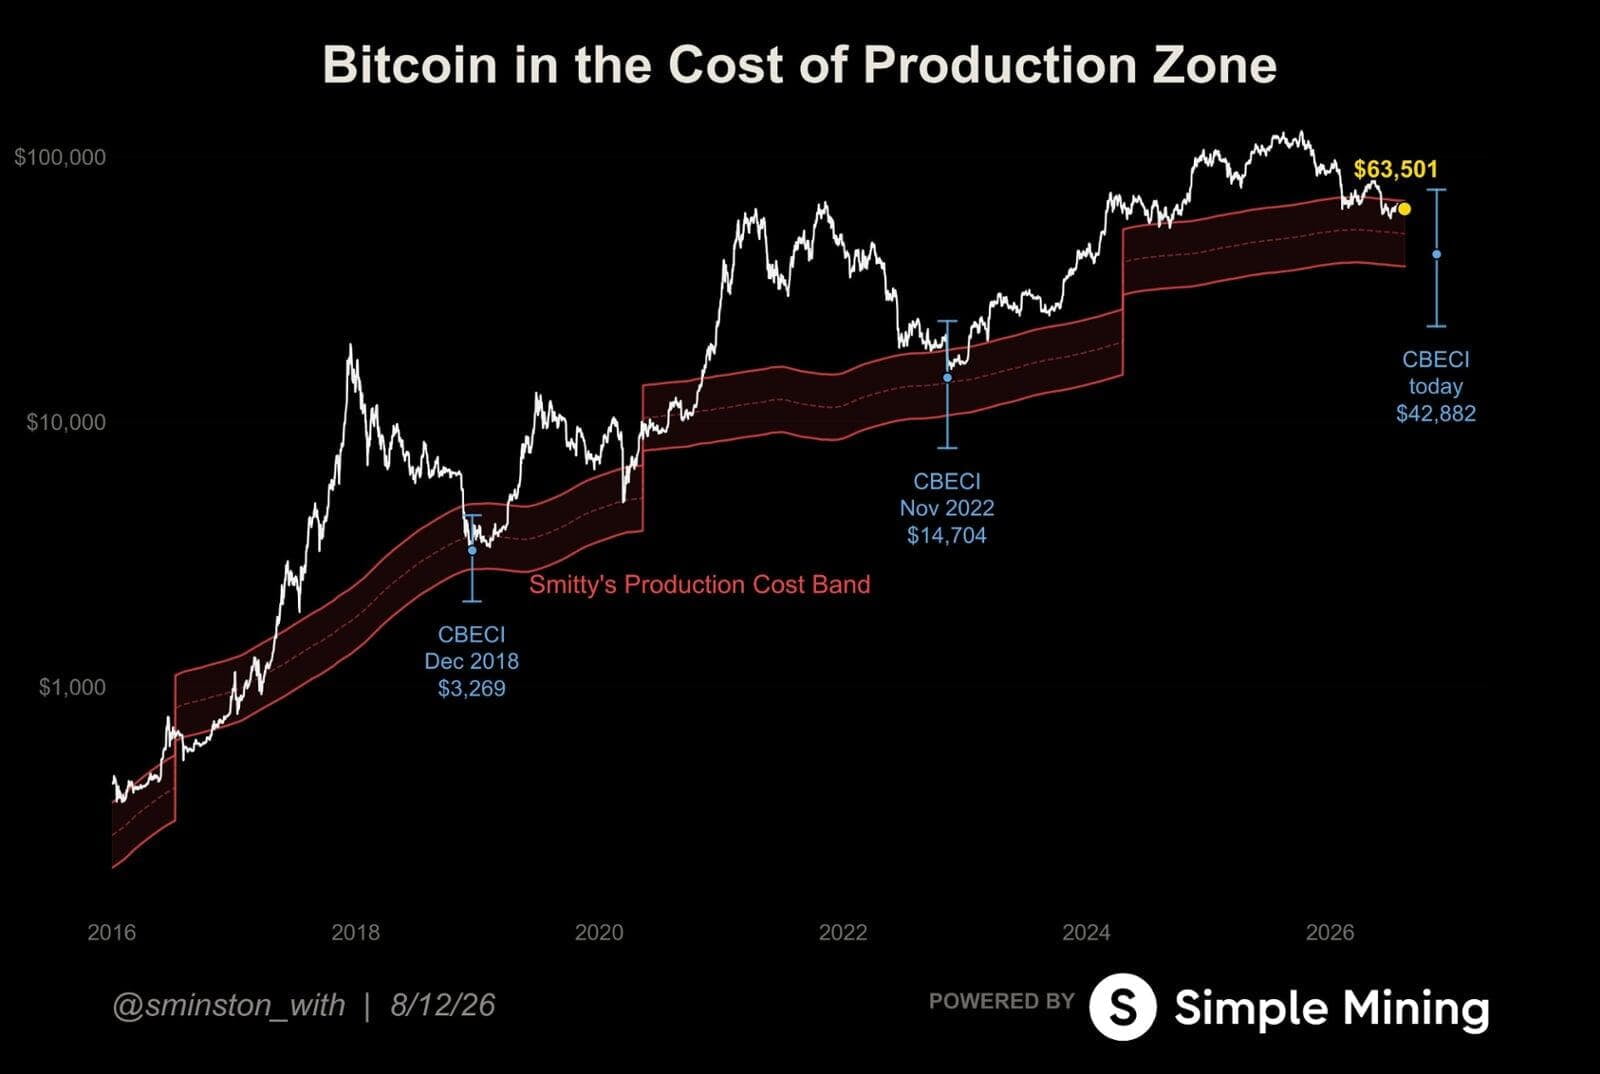
We’re tracking the model above from Simple Mining, and also checked it against data from Cambridge University’s CBECI (Cambridge Bitcoin Electricity Consumption Index), a well respected academic source. Both currently agree that Bitcoin is trading within this cost zone:
The model above: average estimate of $50,821, with an upper bound of $67,526
Cambridge (CBECI): estimated at $43,256, with an upper bound of $75,922
At $64,600, Bitcoin is sitting well above the Cambridge estimate and below the upper end of the model’s range. The two sources broadly agree on the general zone, which gives us more confidence that Bitcoin genuinely is in this cost of production territory, rather than it being a quirk of one particular model.
One thing worth flagging: Cambridge’s number only accounts for electricity costs. It doesn’t include things like hardware, rent or staff wages, which real miners also have to pay. That’s a big part of why its estimate runs lower than the model above, and why the true cost for many miners is likely higher than the Cambridge figure alone suggests.
What History Tells Us
Bitcoin has spent time in this cost of production zone before, and both previous major bottoms happened here:
December 2018: Cambridge estimated the cost of production at around $3,269
November 2022: Cambridge estimated the cost of production at around $14,704
Both of those turned out to be major cycle lows.
There’s also a longer term pattern worth noting. Each bear market low has landed a bit higher up in the cost of production zone than the one before it, rather than falling further below it. In the early days, Bitcoin’s price would crash well under the bottom of the zone before turning around. More recently, it has tended to bottom closer to the middle or top of the zone instead. This pattern has held consistently since 2015.
That matters for how we read the current situation. Just because Bitcoin is in the cost of production zone now doesn’t mean it has to fall further. If the historical pattern continues, a shallower bottom within the zone is more likely than a deep crash below it.
The Key Points
Bitcoin is currently trading in the cost of production zone, with two independent data sources in agreement.
Time spent in this zone has historically lined up with major market bottoms.
Cost of production should be thought of as a zone of support, not an exact price.
Over time, bottoms have tended to land higher up in the zone rather than lower, so the current setup doesn’t automatically point to further downside.
Zooming out, periods where Bitcoin trades in this cost of production zone have historically coincided with the later stages of past bear markets, both in 2018 and 2022. That’s the pattern worth watching, whichever way this cycle plays out.
Stormrake Spotlight: Pax Gold (PAXG) ($4,331)