To receive the Morning Note in your inbox, subscribe here: https://stormrake.substack.com/
We're back with our Q3 Outlook breakdown series, this time looking at Bitcoin against the backdrop of traditional markets.
So far in this series, we’ve looked inward: Bitcoin’s own drawdown history, its own chart structure, its own sentiment cycle. Today we widen the lens and look at Bitcoin relative to something else entirely, US equities.
The Most Expensive Stock Market in a Generation
The Shiller CAPE ratio, a measure of US equity valuations based on ten years of inflation-adjusted earnings, is currently sitting above 41. That level has only been seen once before in over 140 years of market history, at the December 1999 dot-com peak, when the ratio reached 44.19 shortly before the index lost roughly half its value over the following two and a half years. The long-run average for this measure sits around 17.3.
Put simply, US equities are trading at their richest valuation in a generation, second only to the single most infamous bubble in modern financial history.
Bitcoin, Meanwhile, Sits Deep Below Its High
Against that backdrop, Bitcoin is currently trading around 50% below its October 2025 all-time high of $126,272, and has printed a confirmed cycle low of $57,800.
That’s an unusual divergence. Historically, when equity markets are this expensive and this late-cycle, Bitcoin has tended to be more correlated to broader risk sentiment than decoupled from it. Right now we have one asset class near the most stretched valuations it has ever recorded, and another sitting in the deepest part of its own drawdown history. That gap is the setup.
Why This Gap Tends to Close
Extreme valuation gaps between asset classes don’t last indefinitely. Capital is not infinite, and when one part of the market becomes this expensive relative to its own history, the marginal dollar of new capital tends to look elsewhere for a home. Historically, some of that capital has found its way into Bitcoin during precisely these kinds of dislocations, particularly once equity valuations start to correct.
We’re not suggesting equities are about to collapse on a specific timeline, or that Bitcoin will automatically benefit the moment they do. What we are pointing out is that a market this expensive, sitting alongside an asset this depressed, has historically been the kind of setup that precedes a rotation of capital rather than a continuation of the status quo.
There’s also a timing pattern worth flagging. In both of the last two major cycles, Bitcoin didn’t turn the same week equities peaked. It lagged behind the equity reference point by a few months before properly igniting into its next major leg. That lag has shown up consistently enough across cycles that we think it’s worth watching closely for this one too, and we break down exactly where we believe we currently sit on that lag in the full report.
What Would Change This View
If US equity valuations continue climbing without correcting, and Bitcoin fails to attract any of the capital rotation this setup would typically suggest, that would be a reason to reassess this thesis. Valuation extremes can persist for longer than feels rational, and a wide gap on its own is not a trigger, only a condition that has historically preceded a shift.
Combined with the drawdown framework from Part 1, the Wyckoff mirror from Part 2, and the cycle low confirmation, this rotation setup adds a macro dimension to a thesis that has, so far, been built mostly from Bitcoin’s own price history.
For the full breakdown behind this framework, read our complete Q3 2026 Outlook report here.
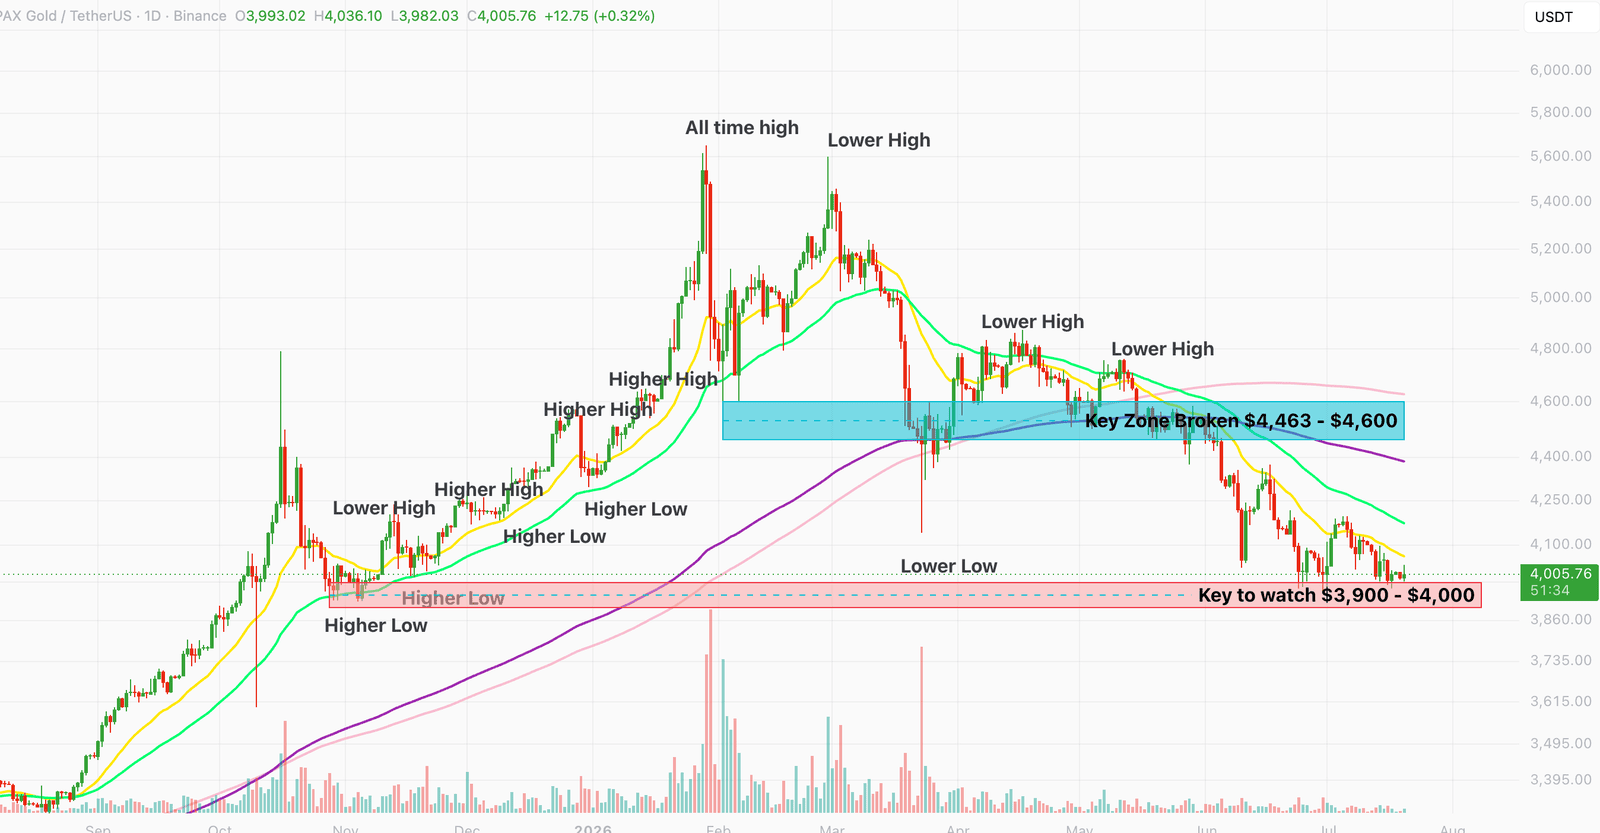
Stormrake Spotlight: Pax Gold (PAXG) ($4,006)
Stormrake Spotlight: Pax Gold (PAXG) ($4,006)