To receive the Morning Note in your inbox, subscribe here: https://stormrake.substack.com/
Last week we mentioned that the rotation is coming, Bitcoin buyers have been more than patient when it comes to Bitcoin price action as they have been watching traditional equities continuing to push all time highs week after week. Today we’re diving into the potential timing of this sought after rotation in digital assets.
We are officially inside the final phase of the bear market. The structural exhaustion we have tracked over recent months suggests there is a maximum of 3 to 6 months left before the digital asset ecosystem fully sheds its weight and begins to scale higher in earnest. But while digital asset investors watch the clock, a broader macro phenomenon is playing out in the background: the traditional risk asset rotation.
To understand where the crypto market is moving, we have to look at where the money is currently resting. Right now, traditional equity markets are enjoying the primary wave of risk on capital flows. The S&P 500 and broader legacy indices have steadily captured global liquidity, leaving digital assets compressed in a later stage accumulation band.
This is not a signal of structural failure for Bitcoin, nor does it imply that traditional equities must suffer a severe capitulation or enter a full bear market for crypto to perform. Instead, it reflects a classic macro playbook where risk capital works its way up the curve, using traditional equity markets as the first pit stop before rotating into high beta, sovereign assets.
Historical data since 2020, when the correlation between traditional finance and Bitcoin grew deeply intertwined, shows this exact staging pattern. Traditional markets frequently lead the initial charge out of macro uncertainty, leaving Bitcoin behind in a temporary lag phase before it violently catches up and ultimately outperforms.
Consider the post-pandemic recovery of 2020. The S&P 500 put in its local bottom in late March 2020 and established a steady, multi-month upward trend as institutional liquidity flooded the market. Bitcoin, meanwhile, spent months grinding through a heavy consolidation range between $9,000 and $10,000, underperforming the initial equity surge. The historical lag lasted roughly 4 to 5 months before Bitcoin ignited its engine, caught up, and rapidly outstripped traditional asset returns by the final quarter of the year.
We witnessed a similar playbook unfold during the transition from late 2022 into early 2023. Legacy equity indices established a definitive bottom in October 2022 and began a structured rally into the new year. Bitcoin remained depressed, absorbing the final capitulation elements of the FTX collapse throughout November and December. The lag between the equity turn and Bitcoin’s explosive catch up expansion was approximately 2 to 3 months, at which point Bitcoin outpaced the S&P 500 by more than 100% over the course of 2023.
The current macro setup is tracking along a highly familiar timeline. Traditional equities have absorbed the initial defensive and risk on liquidity, but as Bitcoin grinds through the final 3 to 6 months of its structural bottom, the window for this rotation is narrowing. Once the capital pool begins to spill over the edge of the traditional curve into digital liquidity, Bitcoin’s phase of compression will give way to rapid outperformance. Ensure you contact your Stormrake Broker ASAP whilst the accumulation window is still open.
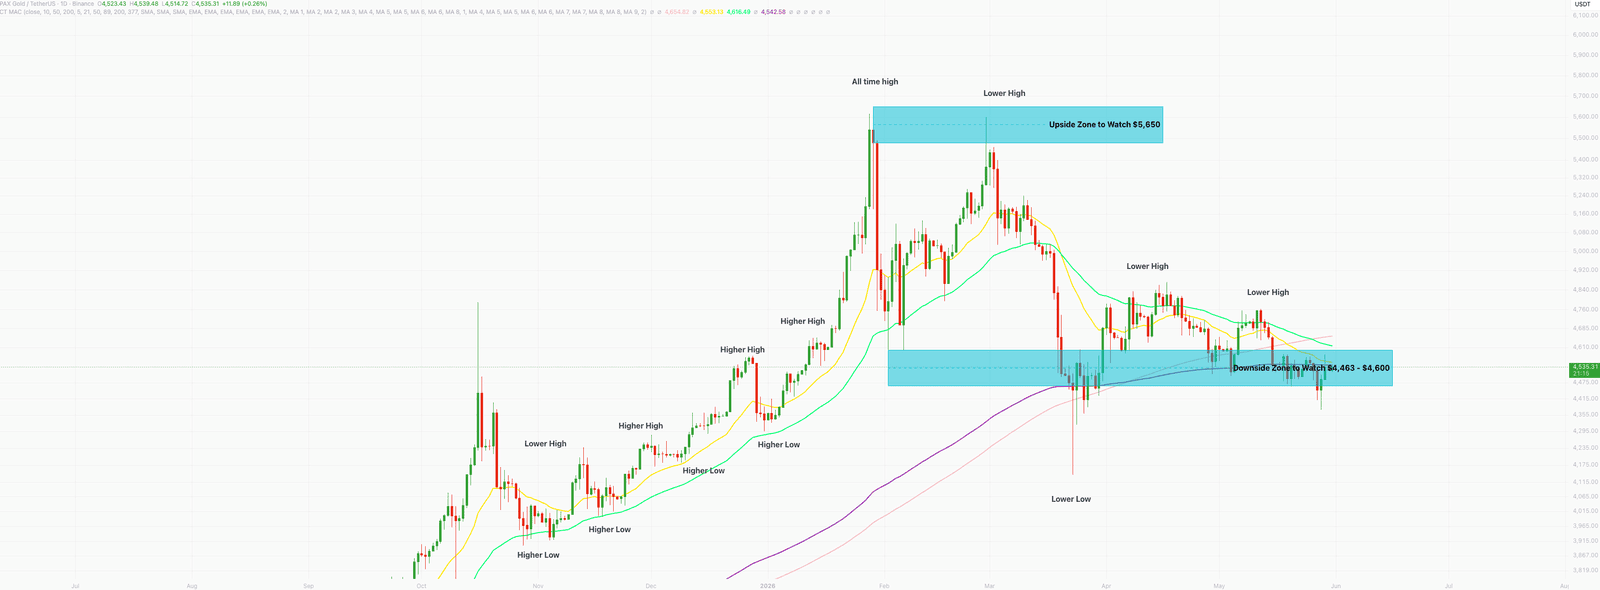
Stormrake Spotlight: Pax Gold (PAXG) ($4,535)
Stormrake Spotlight: Pax Gold (PAXG) ($4,535)