Shaking hands is always touted as the right thing to do when meeting someone for the first time but when it comes to investing, hands that shake don’t bode well. Shakey hands or more familiar to most is the term ‘paper hands’, often describing investors who sell their assets too quickly, usually out of panic or fear of a price drop, folding under the first sign of pressure.
The Mechanics of the Short Term Holder Flush
Recent on-chain data paints a stark picture of how quickly these shaky hands fold when market pressure mounts. A massive, classic capitulation event has played out across the network, with newer buyers panicking and actively transferring their coins to more patient, long term market participants. This supply redistribution is clearly visible in the underlying network mechanics, which track the exact financial pain of those who accumulated near the local peaks.
The proof of this shakeout is laid bare in two critical on-chain metrics:
The $1.35 Billion Daily Hemorrhage: On-chain data shows total realised losses spiked to a massive $1.35 billion per day. Realised loss means these aren’t just paper drops; people are actively hitting the sell button and finalising their losses.
The Profit/Loss Collapse: The 7-day Simple Moving Average (SMA) of the Realised Profit/Loss Ratio collapsed down to 0.29. This means that for every $1.00 of profit being taken on-chain, investors are locking in $3.44 of losses. Profit-taking has completely dried up, and the network is entirely dominated by capitulation.
This extreme flushing of short term holders shows that the market is aggressively cleansing itself of speculative froth. While the aggregate Short Term Holder realised price sits higher at around $76,000, a drop below the critical thresholds represents widespread market distress. Historically, these periods where capitulation dominates are precisely where strategic capital absorbs cheap supply.
The Institutional ETF Rotation
This panic is not restricted to crypto-native portfolios; it has mirrored itself directly within institutional pipelines. Since the 13th of May, the market has witnessed a continuous streak of net outflows from the Bitcoin ETF. This sustained exit of institutional capital aligns perfectly with the recent lower high established at the $83,000 level, where selling pressure intensified.
When analysing the behaviour of traditional investors within the ETF ecosystem, the current exodus can be broken down into two distinct structural scenarios:
Scenario A: Profit Taking
Traditional market participants generally operate with a different performance baseline than crypto-native investors. Seeing Bitcoin up nearly 40% from its recent macro lows, those who entered early are applying a conventional portfolio management mentality, electing to lock in substantial gains and de-risk their positions as momentum slowed near key resistance. ETF flows represent more traditional investors with that mindset; they see Bitcoin up nearly 40% from the lows and their traditional mentality looks to take some profits.
Scenario B: Realising Losses for Traditional Reallocation
Conversely, a substantial volume of institutional inflows entered the ETF complex at much higher prices, with the average Bitcoin ETF entry basis sitting right around the $83,000 mark. With a lot of inflows coming at prices higher, it is safe to assume that the traditional investors who are not familiar with Bitcoin volatility are realising losses and rotating back into equities.
The Institutional ETF Rotation
Sidelining yourself during these moments of short term panic is rarely the path to building long term wealth. History consistently demonstrates that these aggressive flushes create the exact strategic opportunities required to optimise a portfolio. Rather than reacting emotionally to temporary downside, seasoned investors use these volatile windows to absorb supply from panicking short term holders, transferring coins into the hands of long term buyers with deep conviction.
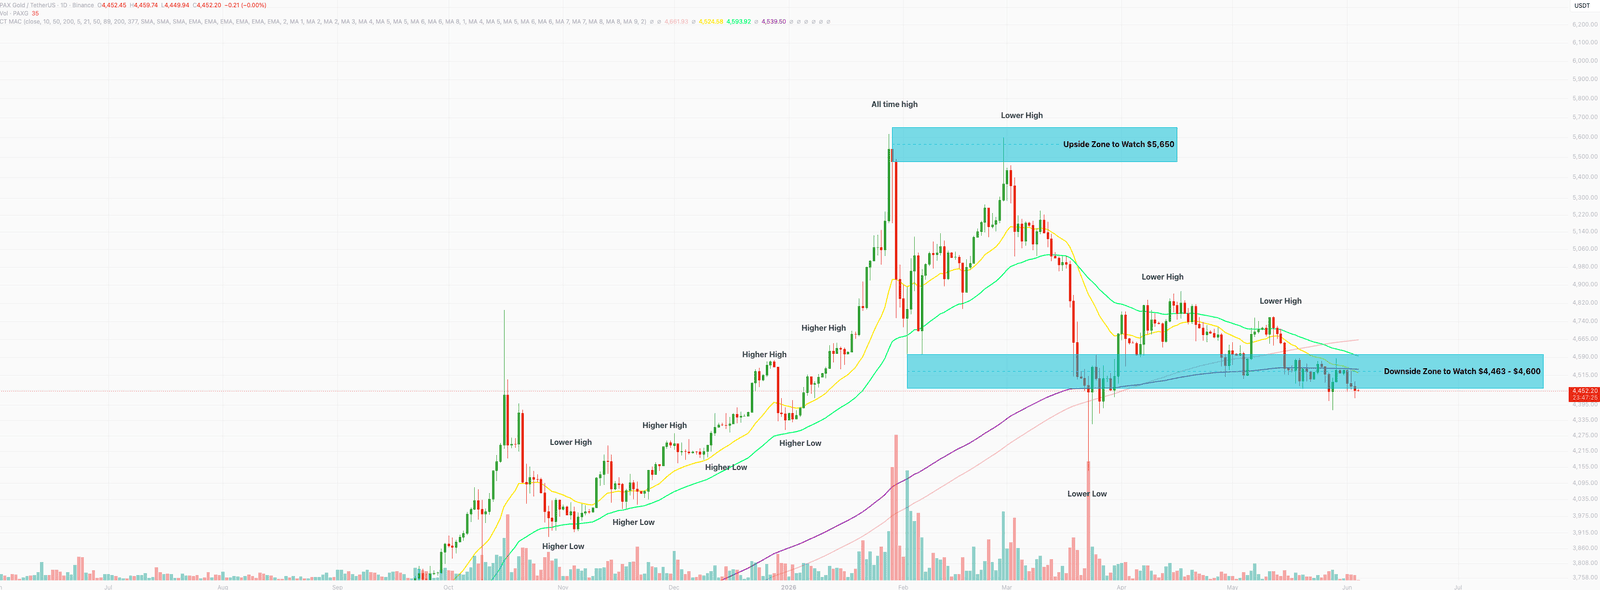
Stormrake Spotlight: Pax Gold (PAXG) ($4,452)