To receive the Morning Note in your inbox, subscribe here: https://stormrake.substack.com/
We have spoken about MVRV in previous articles, but today we are taking a deeper look, specifically through the lens of the Z-Score, which is where the real analytical power lives.
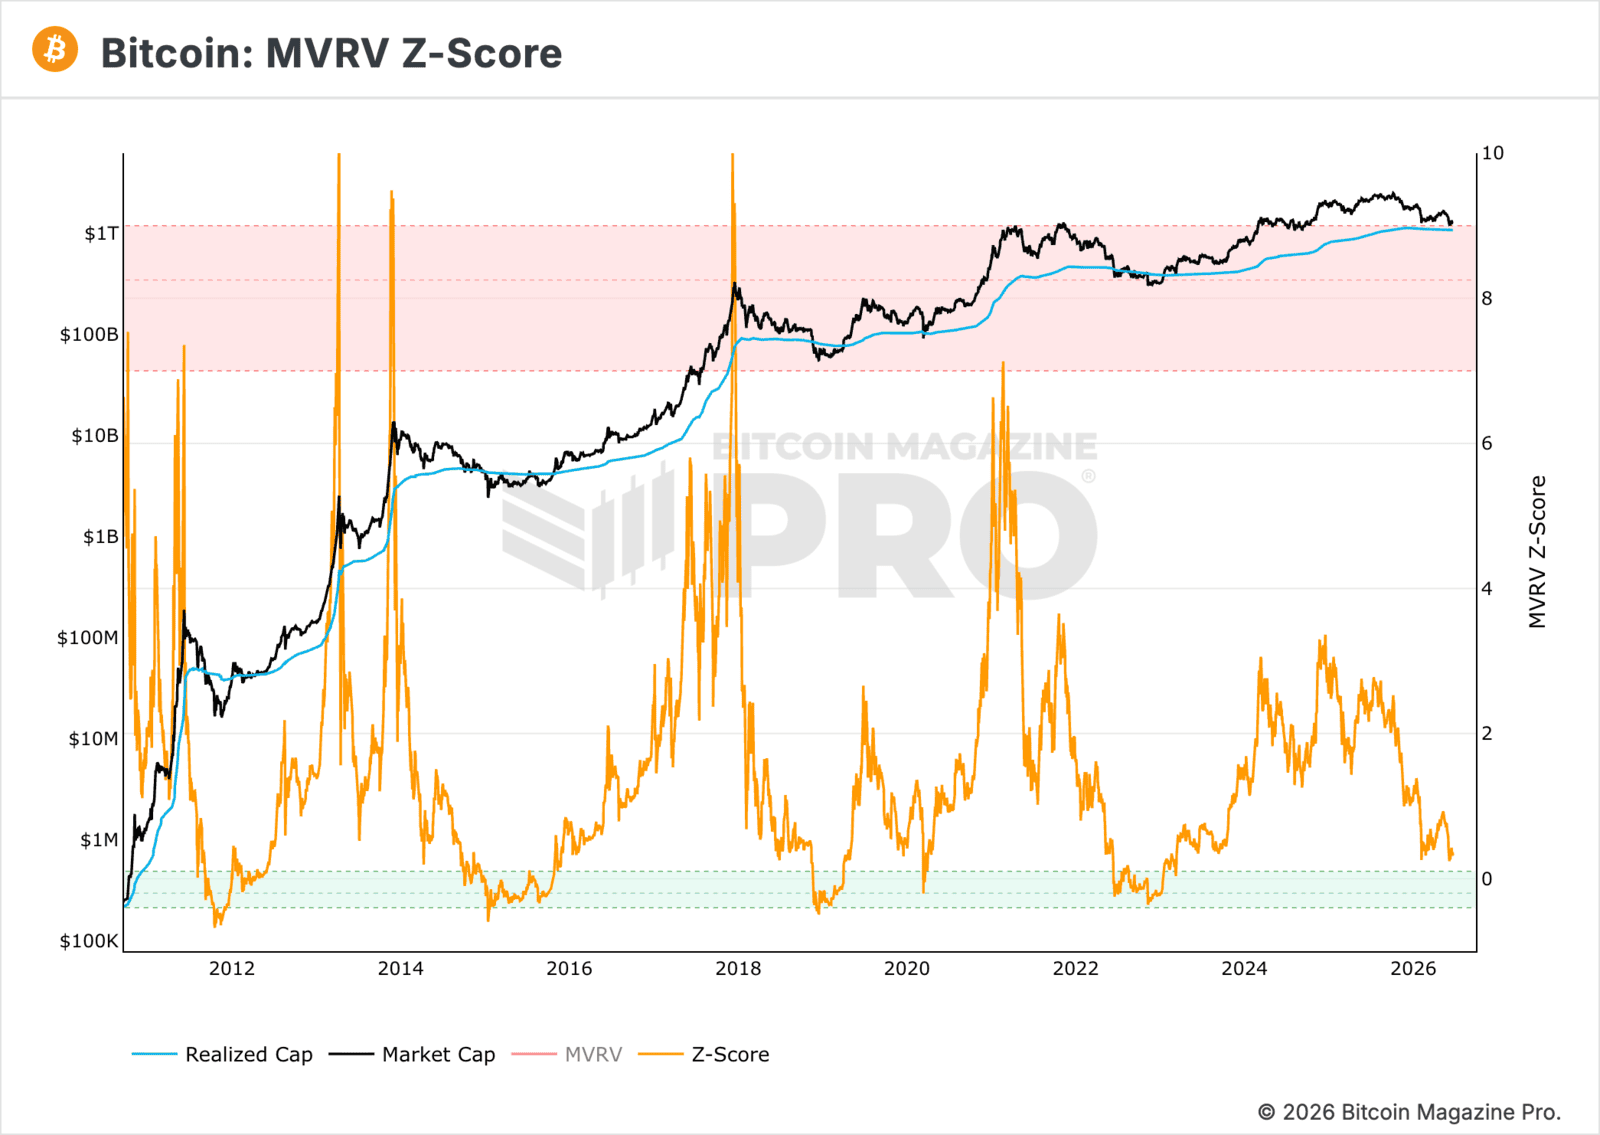
For those less familiar, MVRV stands for Market Value to Realised Value. Market Value is straightforward: the current Bitcoin price multiplied by the circulating supply, essentially the market cap. Realised Value is more nuanced. Rather than using today’s price, it takes the price at which each Bitcoin last moved on-chain (the last time it was sent between wallets), averages those figures across the entire supply, and multiplies by total coins. The result is a measure that strips away short-term sentiment and gives you a cleaner picture of what the market has actually paid for its Bitcoin: the aggregate cost basis.
The ratio between these two figures is the MVRV ratio. When market value is significantly above realised value, participants are sitting on heavy unrealised profit, which historically signals overheating. When market value falls below realised value, the market is trading at a discount to its own cost basis.
The Z-Score takes this one step further. It applies a standard deviation calculation to the spread between market value and realised value across Bitcoin’s entire history. This filters out the noise and isolates the statistical extremes, the moments when the divergence between what Bitcoin is worth and what people actually paid for it is genuinely unusual relative to all prior data. On the chart, when the Z-Score enters the upper red band, Bitcoin has historically been at or near a cycle top. Every major peak in 2013, 2017 and 2021 was flagged by this zone. When the Z-Score enters the lower green band, Bitcoin has been at or near a cycle bottom. Buying within that green zone across every prior cycle has produced some of the greatest returns in the asset’s history.
Where Are We Today?
The Z-Score is approaching the lower green accumulation zone, the same region that has preceded every meaningful bull run on record.
This does not mean the downside is over. It would be dishonest to suggest otherwise. There is a reasonable probability that further pain is ahead, that sentiment remains fragile, and that we will see more volatility before a structural reversal takes hold. The Z-Score can remain in the green zone for weeks or even months as bottoms are a process, not a moment.
But here is what the data is telling us clearly: we are in the zone of asymmetric returns. The risk/reward at these levels, by this measure, is more favourable than at any point since the last bear market lows. The most important variable in capturing those returns is not finding the exact price bottom; it almost never is. It is timing in the broadest sense, being in the market during the accumulation window rather than waiting for the confirmation that always comes too late. When you base decisions on where you are in the cycle rather than on day-to-day price action, you remove the emotional component that causes most investors to buy high and sell low. The data creates the discipline that price alone cannot.
This is the first in a series of onchain metrics we will be walking through over the coming notes. Individually, each one tells part of the story. Together, they are building a clear picture.
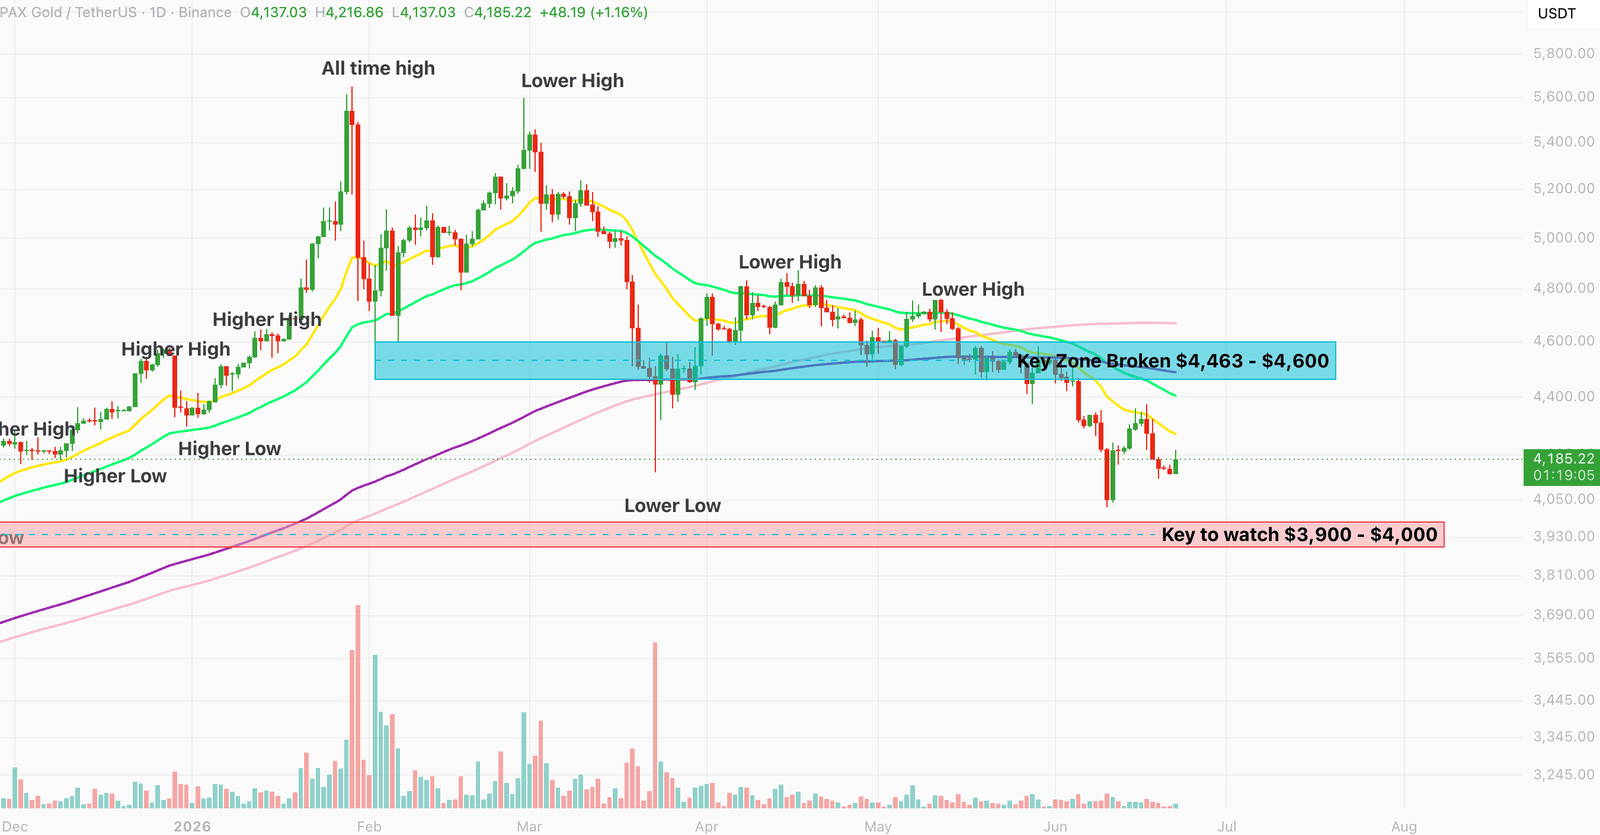
Stormrake Spotlight: Pax Gold (PAXG) ($4,185)
Stormrake Spotlight: Pax Gold (PAXG) ($4,185)