To receive the Morning Note in your inbox, subscribe here: https://stormrake.substack.com/
In Part 1, we made the data-driven case for why the current drawdown is the accumulation opportunity of the cycle. Today we look at two ideas that reinforce that same case: a chart pattern known as Wyckoff, and what’s known as the Depression phase of a market cycle.
Wyckoff: How Tops and Bottoms Actually Form
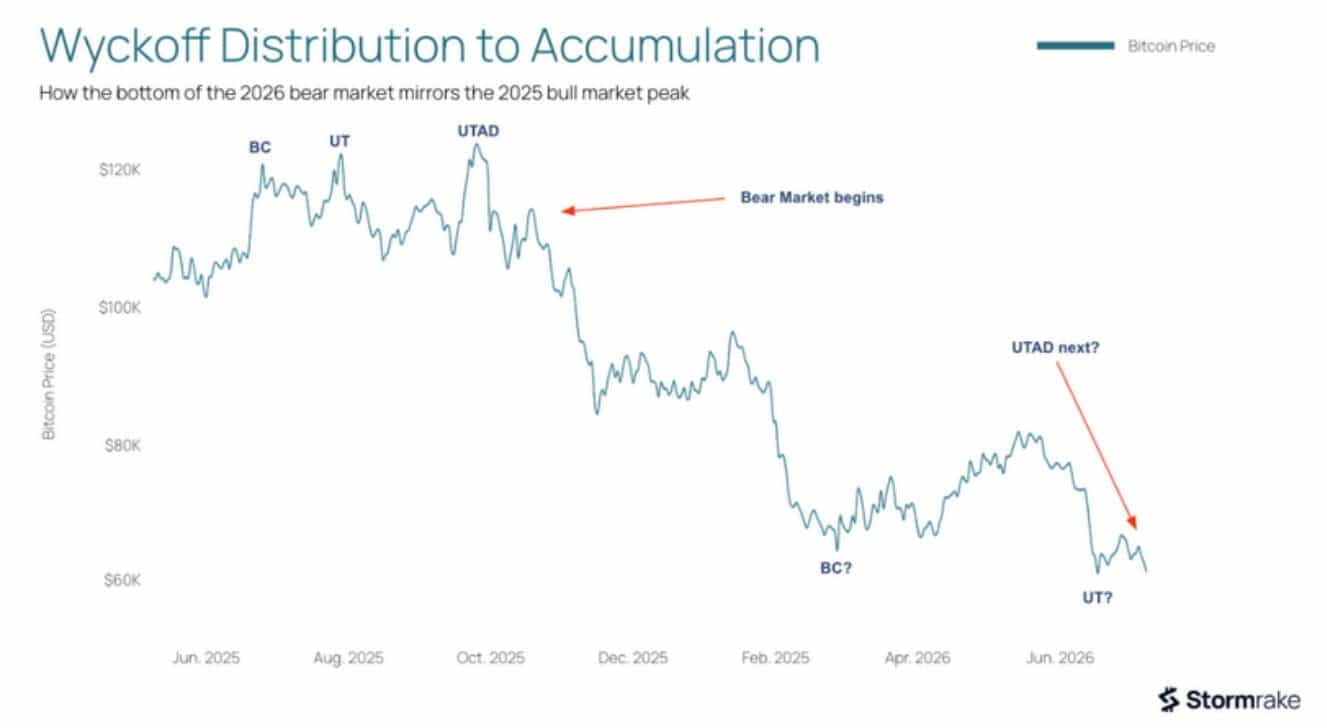
Wyckoff describes how large, patient buyers and sellers build or exit positions gradually, rather than all at once. At a market top, big sellers offload slowly, in a range, while price keeps making new highs. Those final highs draw in the most confident buyers of the entire rally, right before the market turns down. That’s what happened at the top of this cycle.
The chart below shows how it played out. Wyckoff gives these moments specific names. There’s a Buying Climax (BC) at $123,236, an Upthrust (UT) at $124,517, and finally an Upthrust After Distribution (UTAD) at the all-time high of $126,272. Shortly after that final push, the bear market began, with price breaking down through $116,381.