
Q3 2026 Outlook Breakdown – Part 4: What History Says About the Final Leg

23 Jul 2026 10:41 AM By Stormrake

To receive the Morning Note in your inbox, subscribe here: https://stormrake.substack.com/

So far in this series we’ve built the case from Bitcoin’s own drawdown data, the Wyckoff mirror at the top and bottom, and a rotation setup against traditional markets. Today we zoom into the price action itself, and look at a structure that has shown up before the end of a previous cycle too.

Two Lower Highs and a New Cycle Low

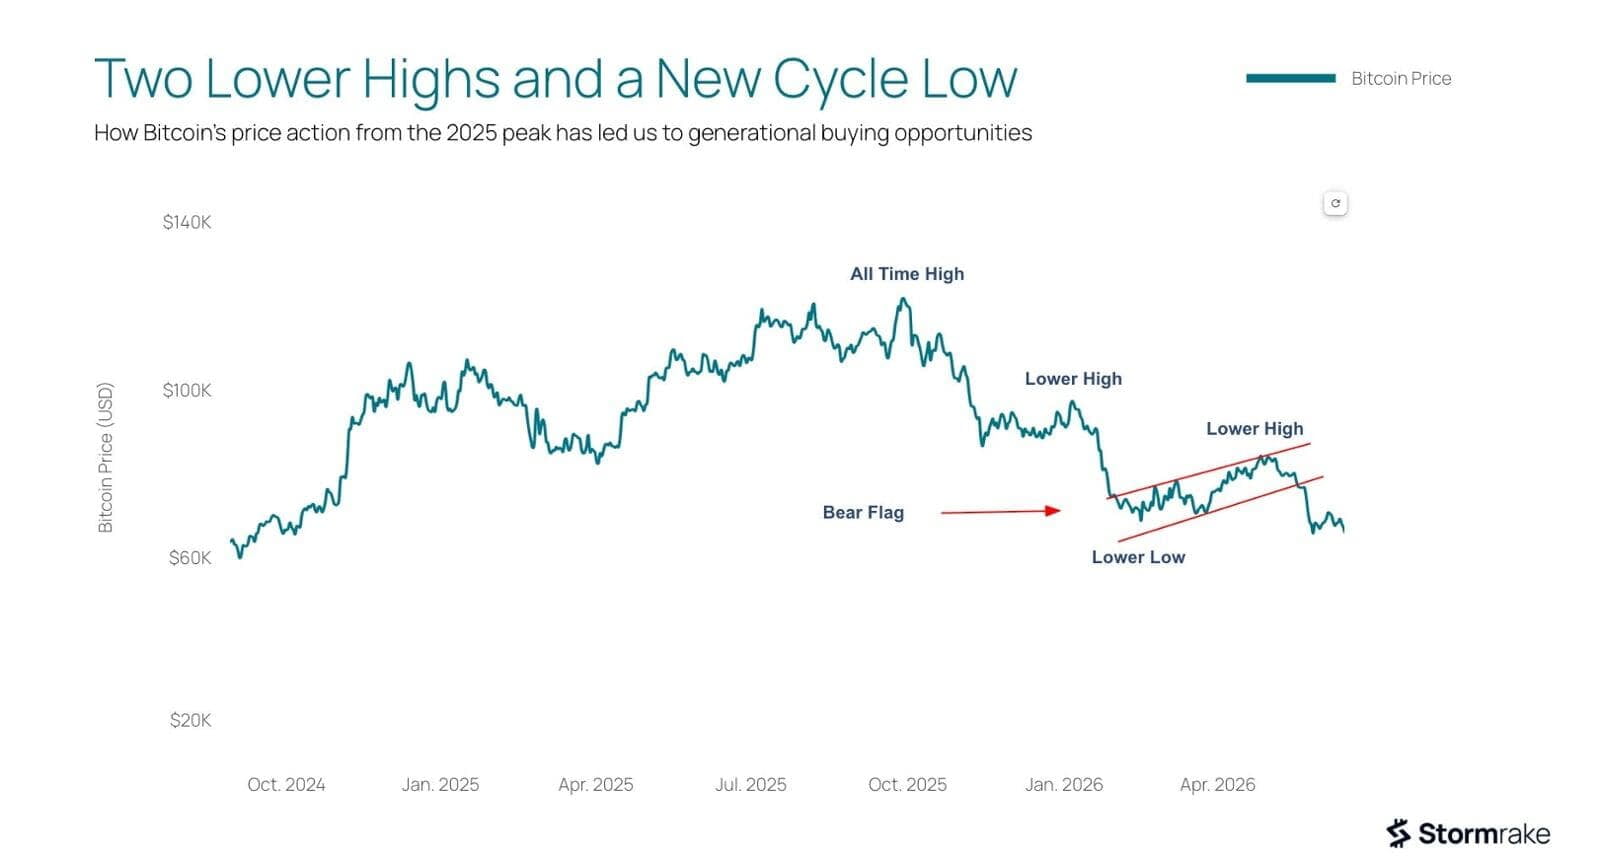
The chart below maps Bitcoin’s price action from the 2025 peak. After the all-time high, Bitcoin printed a lower high, then fell into a bear flag, a descending consolidation pattern that typically resolves in the direction of the prior trend. Inside that flag, price carved out a further lower high and a lower low, before eventually breaking down to a new cycle low.
Source: TradingView, Stormrake Research

This sequence, a lower high, a consolidation, another lower high, another lower low, then a breakdown, isn’t unique to this cycle. It’s a structure that has shown up before at the tail end of a bear market, immediately before the final capitulation.

The 2022 Mirror

The chart below shows the 2022 bear market, and the structure is close to identical to what we’re seeing now. After the all-time high, Bitcoin printed a lower high, then another lower high, before breaking down hard into a bear flag of its own, complete with its own lower high and lower low inside the flag.
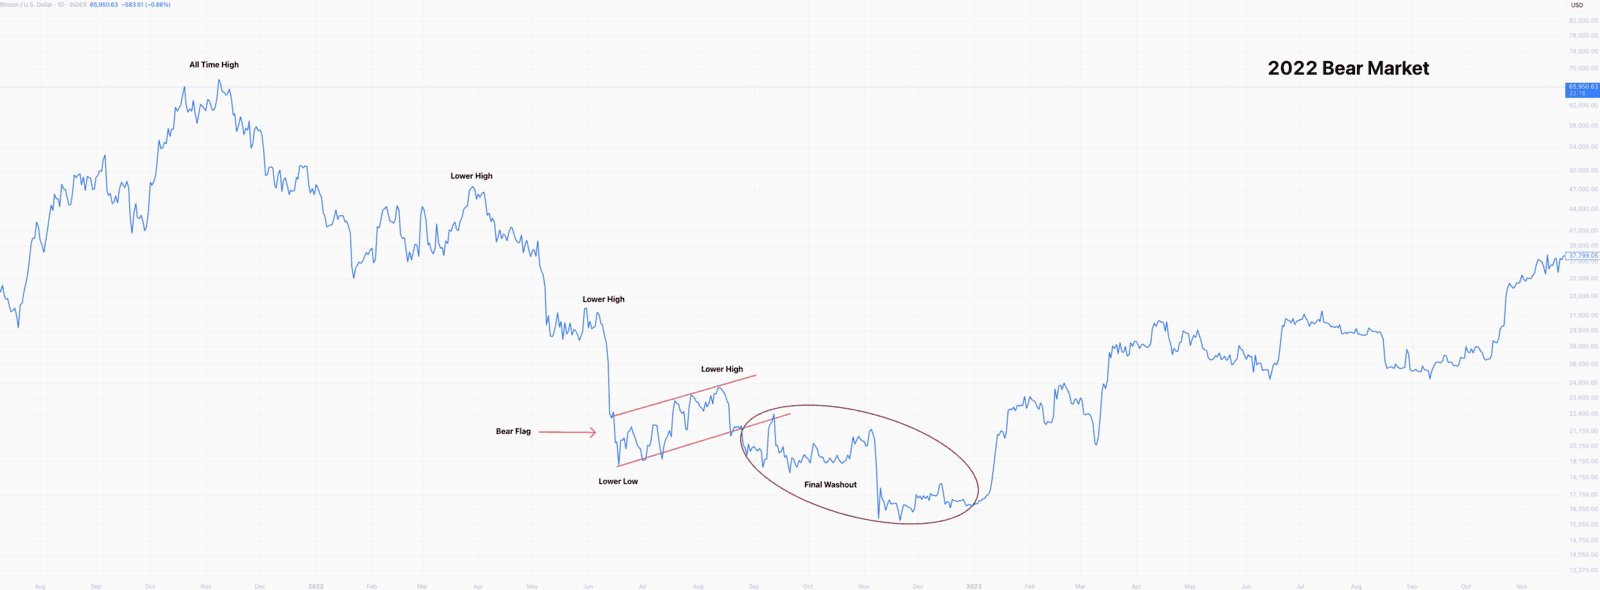
What followed that bear flag is the part worth paying attention to. Price didn’t reverse the moment the flag broke down. It moved into an extended, choppy range that this chart marks as the Final Washout, a drawn-out period of lower prices that eventually gave way to the FTX collapse and the eventual cycle low, before the real recovery began.

That same sequence, all time high, lower high, lower high, bear flag, then a final washout phase before the bottom, is exactly the structure we mapped on the current cycle’s chart in the previous section. The two charts aren’t just similar. They’re close to identical in shape.

Why the Pattern Matters More Than Any Single Level

The value of recognising this structure isn’t in pinpointing an exact price. It’s in recognising the shape of price action that has, before, appeared right before a cycle’s final move rather than in the middle of an extended decline. A market carving out repeated lower highs and lower lows within a narrowing range is a market running out of sellers willing to hold at successively lower prices, not one with fresh conviction to break down further indefinitely.


We’re not treating this as confirmation that the bottom is in. We’re treating it as another data point, alongside the drawdown framework from Part 1 and the Wyckoff mirror from Part 2, that lines up with the idea that we are in the closing stages of this move rather than its early ones.


For the full breakdown behind this framework, read our complete Q3 2026 Outlook report here.

Stormrake Spotlight: Pax Gold (PAXG) ($4,122)

PAXG has increased by 1.2% and finally gotten back above the 21 exponential moving average. We mentioned that PAXG was at make or break, either getting above the overhead resistance or breaking below the key support. It seems the bulls are attempting the former, but this isn’t the first time we’ve seen a break of the 21ema. For this move to have substance, it needs to continue higher and stay above it, otherwise the bears will maintain momentum.

BTC/USD Key Levels and Price Action:

Bitcoin reached the key resistance level of $66.8k and has pulled back over the last 24 hours. Despite the pullback, the bulls remain in control of momentum and structure, and we can expect another retest of this key resistance over the next day or so.
To receive the Morning Note in your inbox, subscribe here: https://stormrake.substack.com/

*All prices are denominated in USD unless stated otherwise*

Written by Alexandar Artis

Create a brokerage account today

No Advice Warning 

The information in this newsletter is general only. It should not be taken as constituting professional advice from the author - Stormrake PTY LTD.
Stormrake is not a financial adviser and does not provide financial product advice. You should consider seeking independent legal, financial, taxation or other advice to check how the information relates to your unique circumstances. Stormrake is not liable for any loss caused, whether due to negligence or otherwise arising from the use of, or reliance on, the information provided directly or indirectly, by this newsletter.
 

Disclaimer 

All statements made in this newsletter are made in good faith and we believe they are accurate and reliable. Stormrake does not give any warranty as to the accuracy, reliability or completeness of information that is contained here, except insofar as any liability under statute cannot be excluded. Stormrake, its directors, employees and their representatives do not accept any liability for any error or omission in this newsletter or for any resulting loss or damage suffered by the recipient or any other person. Unless otherwise specified, copyright of information provided in this newsletter is owned by Stormrake. You may not alter or modify this information in any way, including the removal of this copyright notice.

Copyright © 2024 Stormrake Pty Ltd, All rights reserved

Stormrake