The Rake Review: April

29.04.25 02:07 PM By Stormrake

April Hints at Bitcoin’s True Potential
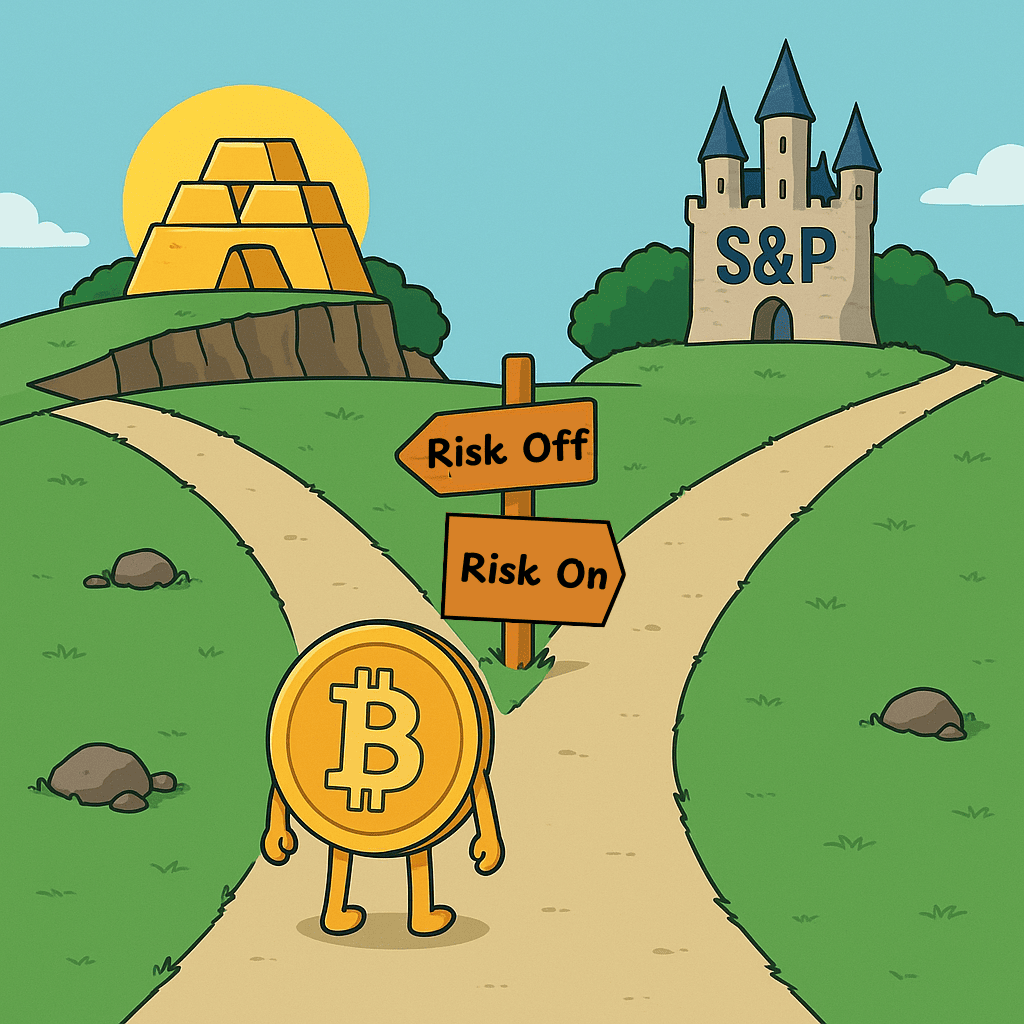
For the longest time, people have debated whether Bitcoin is a risk-on or risk-off asset. Is it a levered Nasdaq, or is it digital gold? What if I told you neither side is wrong — and that April, one of the wildest months in recent memory, proved Bitcoin is, in fact, both.

Foreshadowing Bitcoin’s Potential:

Bitcoin was created to be separate from traditional markets, institutions, and other centralised entities. Many liken it to gold, the original form of hard money — and for good reason. Bitcoin shares many properties with gold: both are scarce, inflation-proof, and serve as a store of value, making Bitcoin a new-age version of hard money — ‘Digital Gold’.

Throughout most of its lifespan, Bitcoin's price has moved independently from traditional stock markets, often following a four-year cycle aligned with the halving event. Looking back at the last 15 years, this cycle typically consists of three bullish years followed by one bear market year. This pattern has held true across the last three full cycles.

However, in recent years Bitcoin has gained institutional traction, and with that, a growing correlation to traditional assets — particularly risk-on markets like the S&P 500 and Nasdaq. Many now refer to it as a levered version of the QQQ, or virtually another tech stock.

Over the last few years, we’ve seen Bitcoin react similarly to traditional markets during major global events — from the Covid pandemic to interest rate decisions and geopolitical shocks. Through the confusion that was April, Bitcoin acted as both. It rallied during a risk-on environment alongside the Nasdaq when the 90-day tariff pause was announced — Bitcoin rose 8%, and the Nasdaq jumped 13%. Then Easter ushered in a risk-off tone as the US 10-Year Note yield surged above 4.40%, and major equities like Nvidia and Amazon dropped 4.5% and 3.1% respectively. Meanwhile, Bitcoin continued its climb, and gold pressed on to new all-time highs.

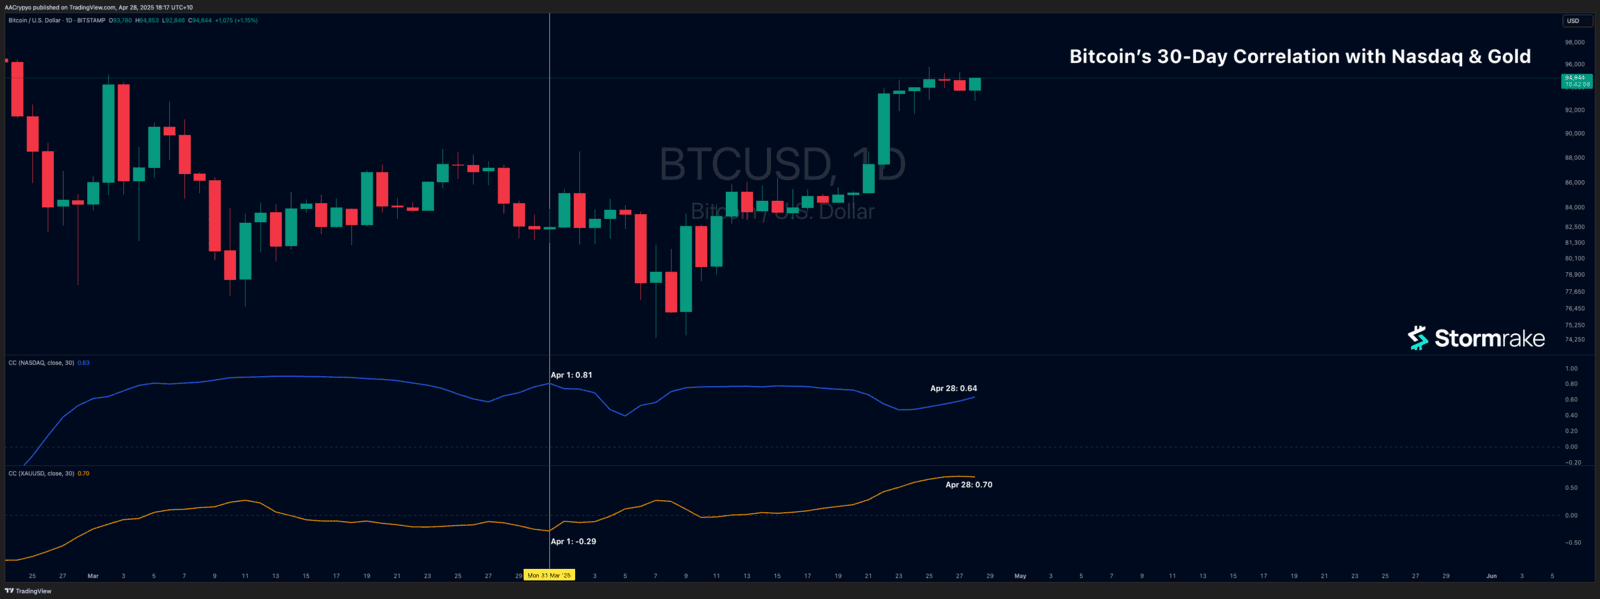
This price behaviour was further reflected in cross-asset correlations — a measure of how closely two assets move together. In simple terms, a correlation of +1 means two assets move exactly the same way, –1 means they move in opposite directions, and 0 means there’s no relationship at all. A chart comparing Bitcoin’s 30-day correlation with the Nasdaq and gold shows that, as of April 28, BTC had a strong positive correlation with both the Nasdaq (+0.64) and gold (+0.70). Earlier in the month, Bitcoin had tracked equities closely, reaching a high correlation of +0.81 with the Nasdaq around April 1, but later dipped into negative territory before recovering. Its correlation with gold, meanwhile, flipped from negative (–0.29) to strongly positive over the same month. This dual correlation is rare — and highlights Bitcoin’s unique position: rallying alongside both risk assets and safe havens, proving it doesn’t neatly fit into traditional asset categories.

This past month has shown Bitcoin’s versatility more clearly than ever. Its ability to thrive in both risk-on and risk-off conditions marks a radical shift in how it trades — and perhaps how it's perceived. There is no other asset like it. Gold rallies in risk-off environments and during market uncertainty, while traditional stocks thrive in risk-on conditions. April proved that Bitcoin can behave like both — and rally in both. What we’re witnessing may just be the early signs of Bitcoin’s evolving role in global markets — no longer confined to a single narrative or asset class. As adoption grows and its use case continues to expand, Bitcoin’s ability to bridge the gap between growth and defensive assets could make it one of the most dynamic and adaptable financial instruments of the next decade.

The future is promising — and Bitcoin is only just getting started.

Stormrake at the Gold Coast Gold Conference:

This month, Stormrake Co-Founder and CEO Michael Milmeister presented at the Gold Coast Gold Conference, joining a timely conversation on hard money in an era of accelerating monetary instability. Our message was clear: Bitcoin and gold are not rivals — they’re allies in the same fight against a failing fiat system. Both are scarce, decentralised, and resilient to debasement. Far from being competitors, Bitcoin is the ultimate compliment to any gold bug’s portfolio — delivering the core properties of hard money, with the added advantages of portability, programmability, and a 24/7 global market.

The Most Confusing Month in Recent History:
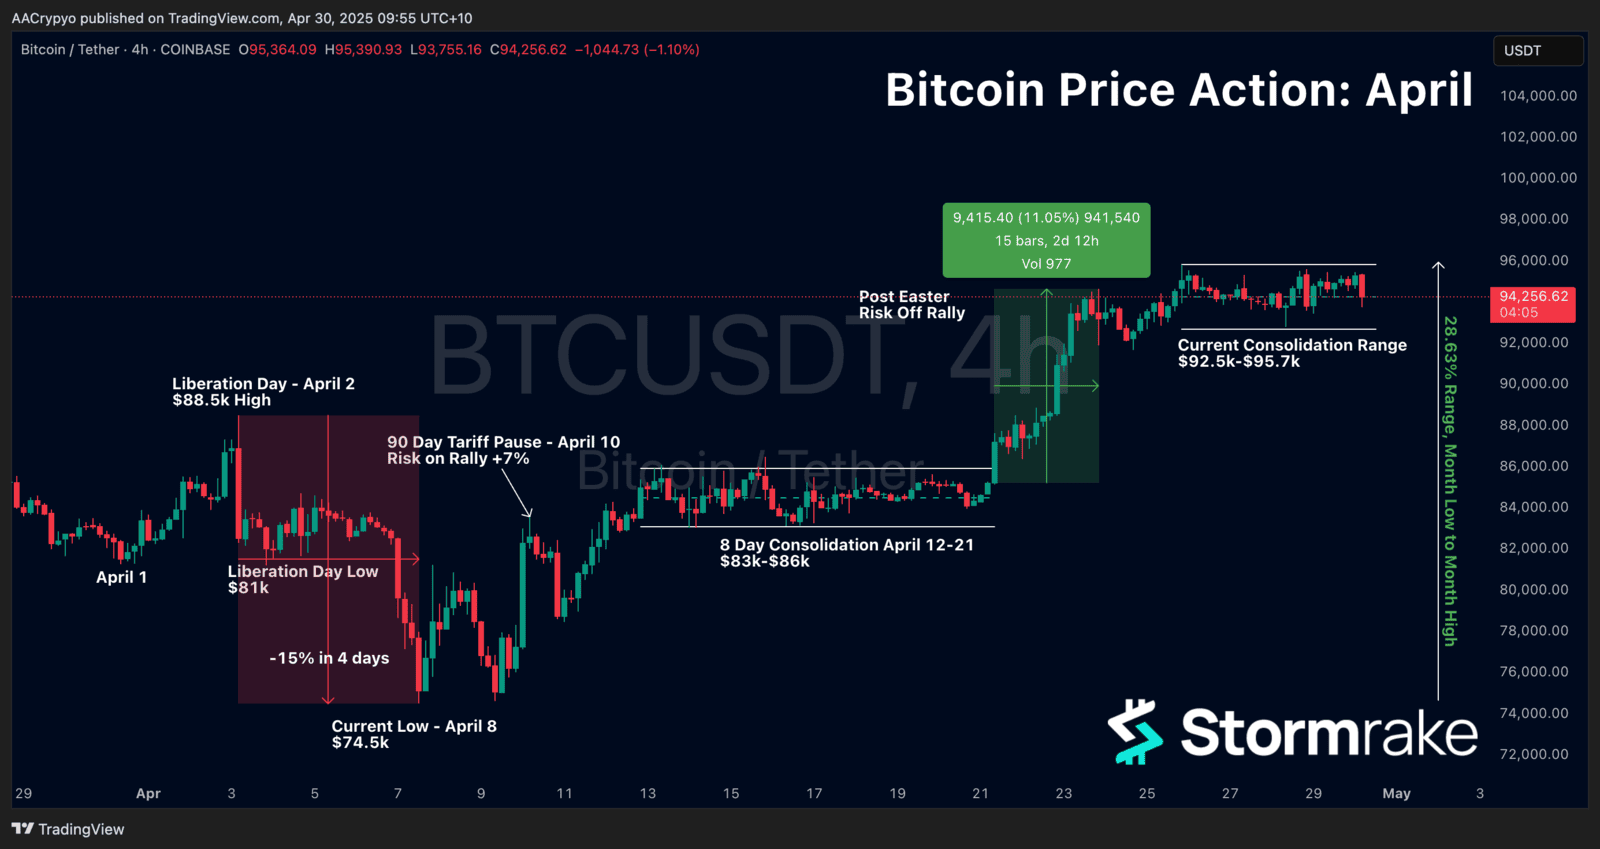
We’ve just witnessed what’s probably the most confusing month since March 2020. April 2025 will go down in the history books — and be studied for years. Everyone expected volatility, especially with Trump setting a new precedent during his second stint in office.

The month kicked off with chaos. Trump’s Liberation Day was a shock to all, with tariffs slapped on 185 countries — each receiving a minimum of 10%, and China hit hardest at 34% (just the beginning for them). Markets tumbled. Over the next week, both the S&P 500 and Nasdaq entered bear market territory (a 20% correction from their peaks), and Bitcoin dropped from $88K to a low of $74.5K.

At this stage, panic was everywhere. Fake tariff headlines triggered 5% intraday swings in the S&P 500. China began retaliating. Sentiment hit multi-year lows. Gold surged to new all-time highs day after day, while the S&P 500 rivalled the worst periods of Covid, the Global Financial Crisis, and the dot-com bubble in terms of four-day drawdowns. Investor confidence collapsed. The S&P 500’s Fear and Greed Index hit a reading of 3. Crypto markets also slipped into extreme fear — yet Bitcoin held above February’s low of 10.

People were chanting that it’s over — the bear market is back. Bitcoin’s headed for the $60Ks, maybe even the $50Ks. But how often are the majority right in predicting market direction? Not very…

At that moment, Buffett’s timeless quote should’ve been ringing in every investor’s ears: “Be greedy when others are fearful.” For Stormrake clients who acted on that, the reward came fast. We emphasised the opportunity in this down period — and it didn’t last long. Trump announced a 90-day tariff pause, and risk-on markets snapped back. Equities climbed out of bear market territory, and Bitcoin reclaimed $80K.

After rebounding off the $74.5K low on April 8, Bitcoin entered a tight 8-day consolidation phase between $83K–$86K, reflecting market indecision as traders processed the tariff headlines and macro mess. This base formation set the stage for the post-Easter breakout, where Bitcoin surged more than 11% in just 2.5 days — a risk-off rally that defied broader equity weakness. From the April low to its late-month high, Bitcoin traded in a 28.63% range — one of the widest monthly spreads in over a year, underscoring April’s extreme volatility.
While battling China, Trump also reignited a personal feud with Fed Chair Jerome Powell — a one-sided affair, with Trump hurling online abuse and demanding immediate rate cuts, while Powell stood firm, reiterating that policy decisions would remain data-driven.

After its worst first quarter in years, Bitcoin is now up 15% in April and 12% since Liberation Day, despite all the chaos. Meanwhile, both the Nasdaq and S&P 500 remain down since April 2. Gold is up 5%.

All of this reinforces Bitcoin’s versatility — thriving in risk-on and risk-off environments alike — and offers a glimpse of what’s to come.

In the News:

Mantra (OM) Collapse:

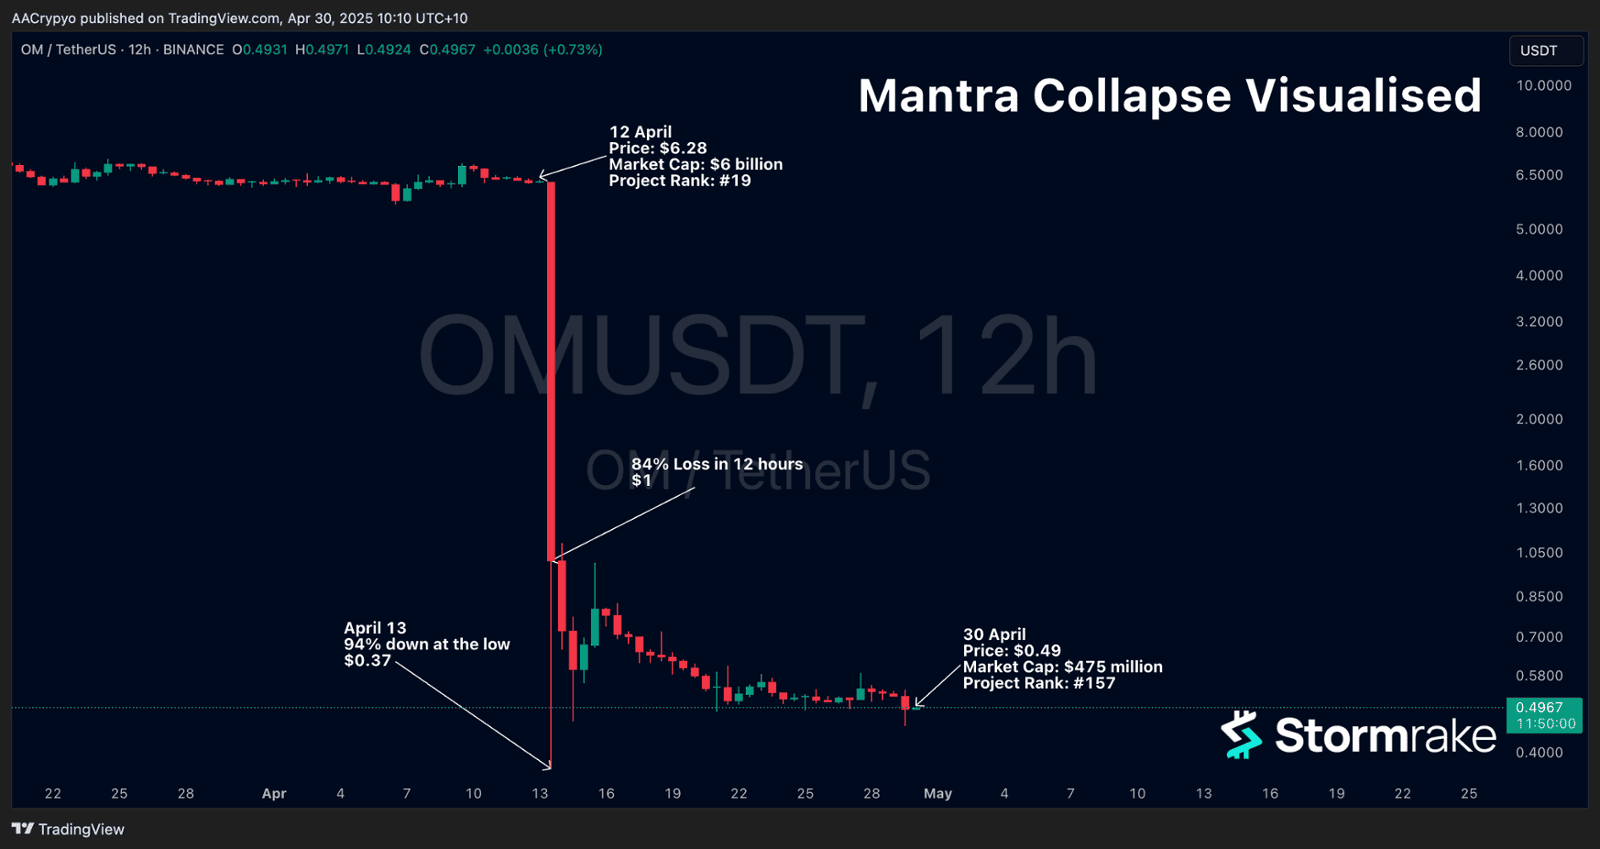
Not all headlines were positive. Mantra (OM) — the 19th largest crypto project and leading Real World Asset (RWA) protocol — collapsed in under 12 hours. At midnight, OM was trading at $6.50 with a market cap near $6B. By midday, it had plunged to $1.00, wiping out $5B in value — a staggering 90% drop. Many red flags had been ignored…

90-Day Tariff Pause:

We touched on the bullish impact of the 90-day tariff pause — here’s a deeper take. Tariffs remain in place. All countries still face a 10% minimum. Canada and Mexico are still at 25%, and China is at 145%. Additional 25% tariffs still apply on imports of autos, steel, and aluminium. This pause doesn’t remove tariffs — just delays the full return of Liberation Day levels. Unless agreements are reached, the full tariff regime may return in late July.

Australian Super Funds Hacked:

Some of Australia’s largest superannuation funds were hit by a major cyberattack this month. Affected: AustralianSuper, Hostplus, REST, Australian Retirement Trust, and Insignia — collectively managing over $700B. Pension-phase members were targeted, login access suspended, and mass panic followed.

This reinforces why we advocate for holding Bitcoin in your Self-Managed Super Fund — take control of your retirement, don’t leave it in the hands of third parties.

Market Update:

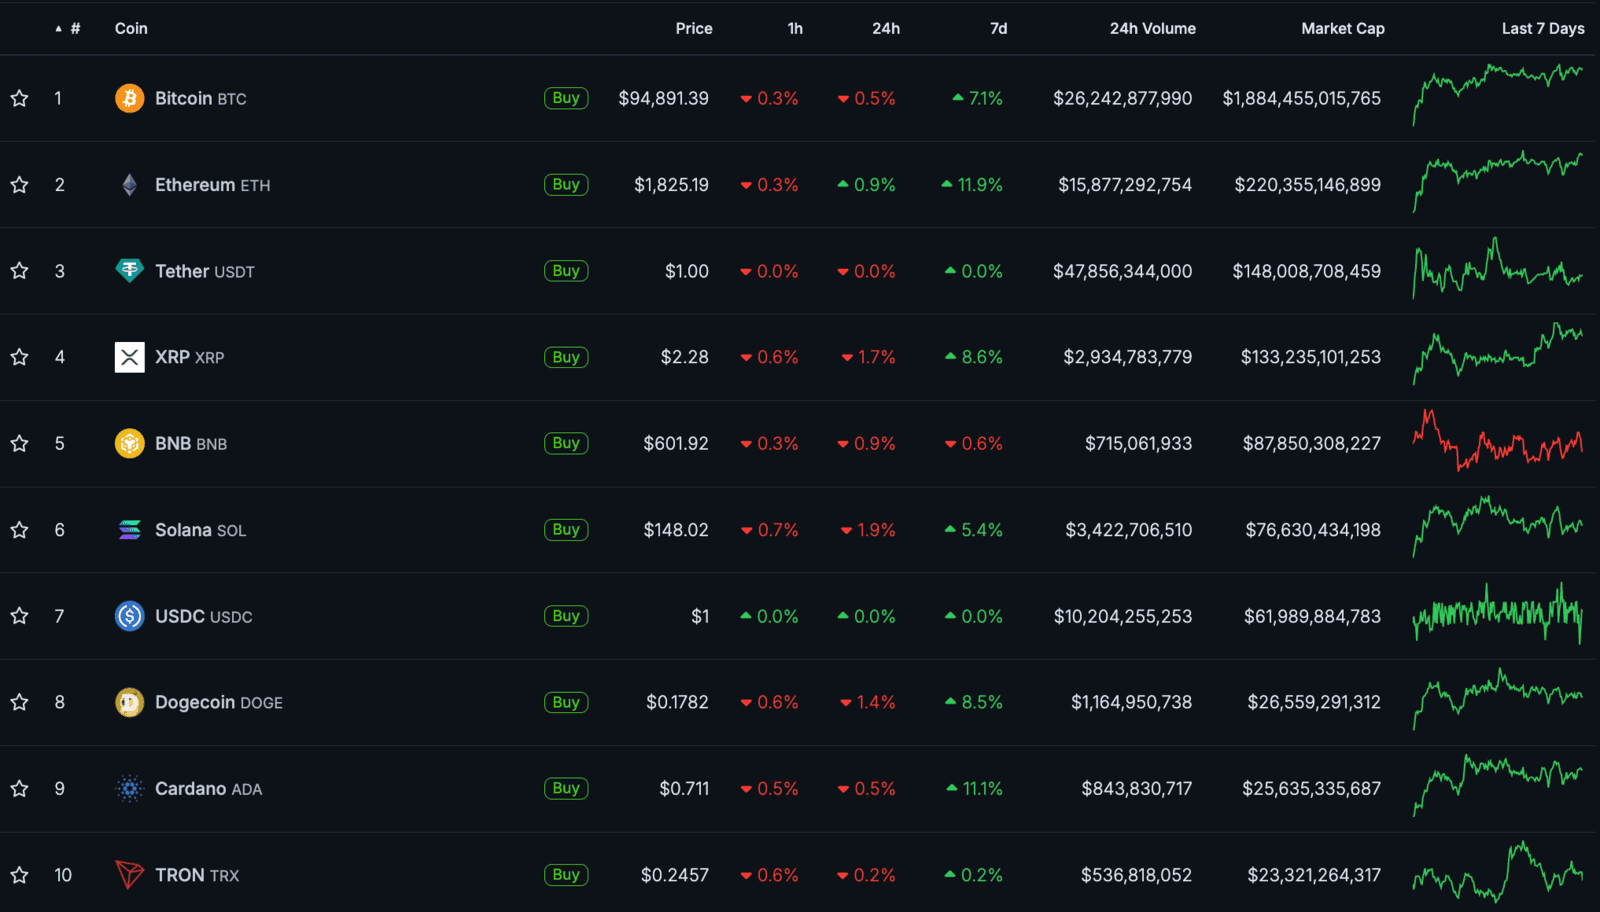
Top 10 cryptocurrencies by market cap
Here is the fast five of what you need to know about the market in April 2025:
    1. Bitcoin rose 15.1% in April
    2. Ethereum struggled, ending the month down 2% despite Bitcoin’s strength
    3. The top 10 coins and their rankings remained unchanged from March
    4. Memecoins led the charge — 3 of the top 5 performers in the top 100 were memecoins
    5. After a 50% gain in April, Sui is now just three spots away from breaking into the top 10

    Video of the month:

    'What is Hard Money?' - Michael Milmeister, Stormrake

    Education: Bitcoin’s Correlation to M2 Money Supply
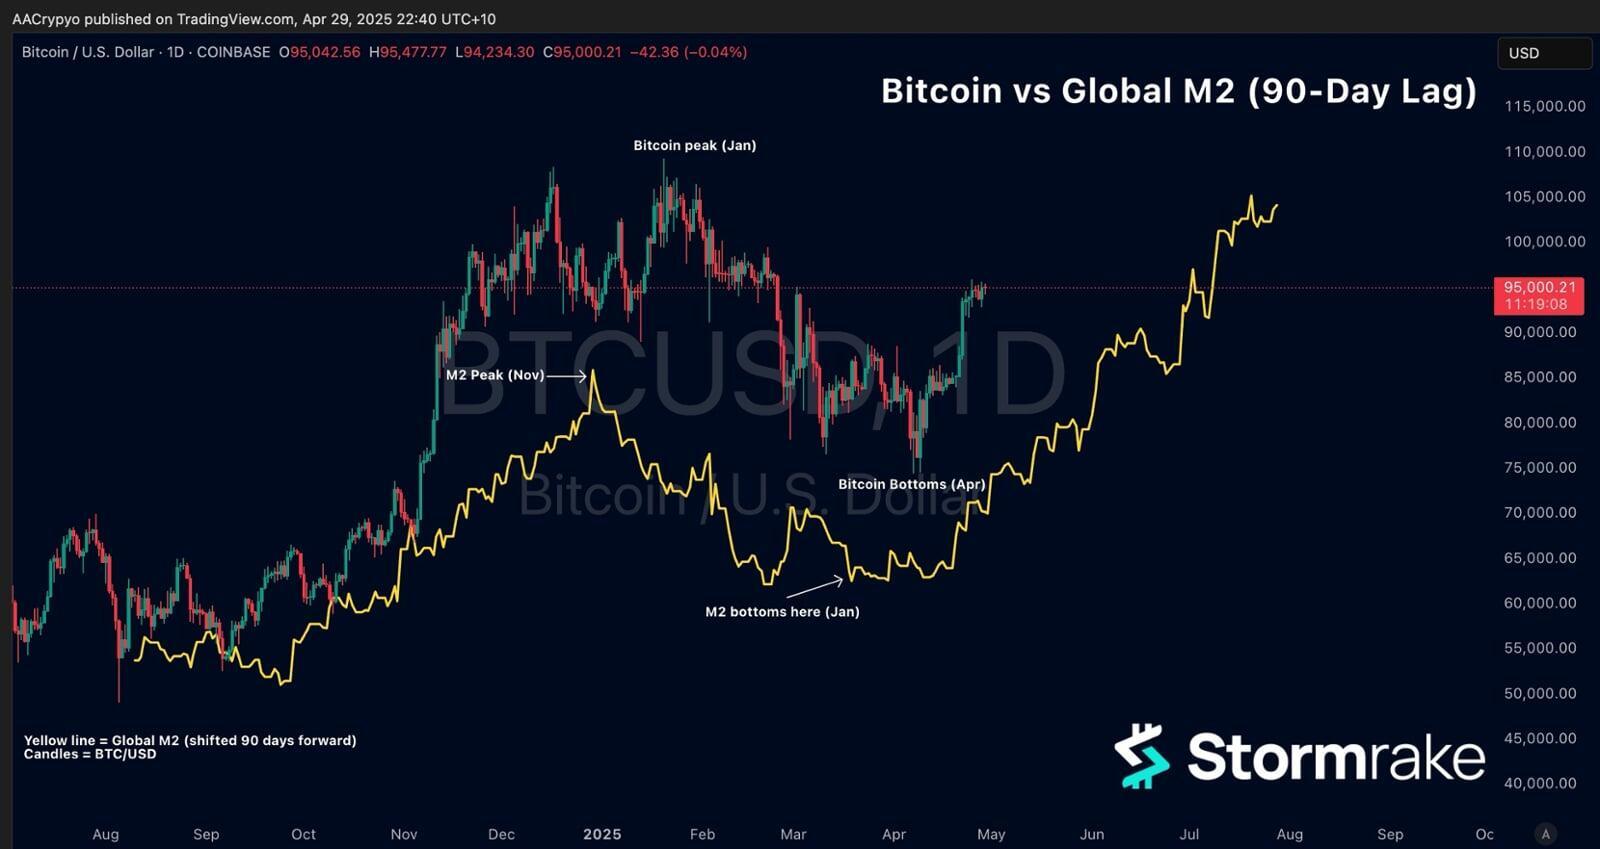
    The most important driver of long-term asset performance isn’t just hype or headlines—it’s liquidity. And the most reliable proxy for global liquidity is the M2 money supply. M2 includes cash, checking deposits, and near-money like savings—essentially the fuel for risk-on behaviour in markets. When M2 expands, it signals the presence of excess capital. That capital doesn’t sit still—it searches for returns, first moving into equities and real estate, then into higher-beta assets like crypto. When M2 contracts, this process reverses: risk assets draw down as liquidity dries up.

    Historically, Bitcoin’s price has shown a clear lagging correlation with global M2 by approximately 70–90 days. This lag is a function of capital rotation. Institutional money doesn’t immediately flow from new liquidity into crypto—it first works through treasuries, credit, then equities, and finally into digital assets. This is why crypto is often the tail-end beneficiary of monetary expansion, but also why it tends to outperform when the liquidity tide is truly rising.
    The chart above brings this relationship to life. The yellow line represents global M2 (shifted forward 90 days); the candles represent BTC/USD.

    • M2 peaked in November 2024—Bitcoin topped out in mid-January 2025, almost 80 days later.
    • M2 bottomed in late January; Bitcoin followed with its local low in mid-April.
    • M2 has since surged higher—suggesting the next move for Bitcoin could already be underway.

    This pattern aligns with previous macro cycles. During the 2020–2021 bull market, M2 in the United States grew by over 25% YoY, coinciding with Bitcoin’s rise from $10K to $69K. That growth was fuelled by quantitative easing and fiscal stimulus—both of which drove an enormous surge in monetary aggregates. As soon as the Fed began tapering and M2 growth turned negative in late 2022, risk assets faltered.

    We’re now seeing subtle signs of a shift back toward expansion. The Federal Reserve has begun re injecting liquidity into the system—through reverse repo declines, balance sheet management, and increased Treasury issuance supported by indirect monetisation. Meanwhile, the ECB and BOJ remain accommodative, helping drive global M2 higher once again.

    It’s not just theory—it’s the maths of the macro cycle.

    If history rhymes, we are in the early stages of Bitcoin’s next major leg. With M2 having bottomed in January and already climbing steadily, Bitcoin could track higher into late Q2 and Q3, if the 70–90 day lag remains consistent.

    This framework offers more than a narrative—it provides a data-driven lens for anticipating crypto market direction. It underscores the importance of watching liquidity flows rather than price alone. Traders may focus on patterns, but macro investors track the current. Right now, that current is turning.

    Liquidity leads. Bitcoin follows. It’s a proven formula—fade it at your own risk.

    Memes of the Month

    Written By Alexandar Artis

    Start Your Brokerage Account

    If you enjoyed this Rake Review, feel free to open an account and gain access to more proprietary research and work with your very own dedicated crypto broker.

    No Advice Warning 

    The information in this newsletter is general only. It should not be taken as constituting professional advice from the author - Stormrake PTY LTD.
    Stormrake is not a financial adviser and does not provide financial product advice. You should consider seeking independent legal, financial, taxation or other advice to check how the information relates to your unique circumstances. Stormrake is not liable for any loss caused, whether due to negligence or otherwise arising from the use of, or reliance on, the information provided directly or indirectly, by this newsletter.
     

    Disclaimer 

    All statements made in this newsletter are made in good faith and we believe they are accurate and reliable. Stormrake does not give any warranty as to the accuracy, reliability or completeness of information that is contained here, except insofar as any liability under statute cannot be excluded. Stormrake, its directors, employees and their representatives do not accept any liability for any error or omission in this newsletter or for any resulting loss or damage suffered by the recipient or any other person. Unless otherwise specified, copyright of information provided in this newsletter is owned by Stormrake. You may not alter or modify this information in any way, including the removal of this copyright notice.

    Copyright © 2022 Stormrake Pty Ltd, All rights reserved

    Stormrake