To receive the Morning Note in your inbox, subscribe here: https://stormrake.substack.com/

Today’s morning note is a tad longer than usual, but it’s a must read for anyone tracking Bitcoin price and the search for the cycle low. I’d urge you to stick around and read it in full.
For readers who’ve been with us for close to 12 months, you may recall the Morning Note welcoming everyone to the bear market. That call was based on key technical analysis that has historically signalled the start of past bear markets.
We may not be far from the point where that same analysis flips to confirm the bull market. Today we’re covering similar technical signals that have historically marked the end of a bear market, and for the first time in this cycle, the weight of evidence is stacking up in the bulls’ favour. The case is building fast, and it’s looking increasingly hard to bet against.
The Bear Market Trendline
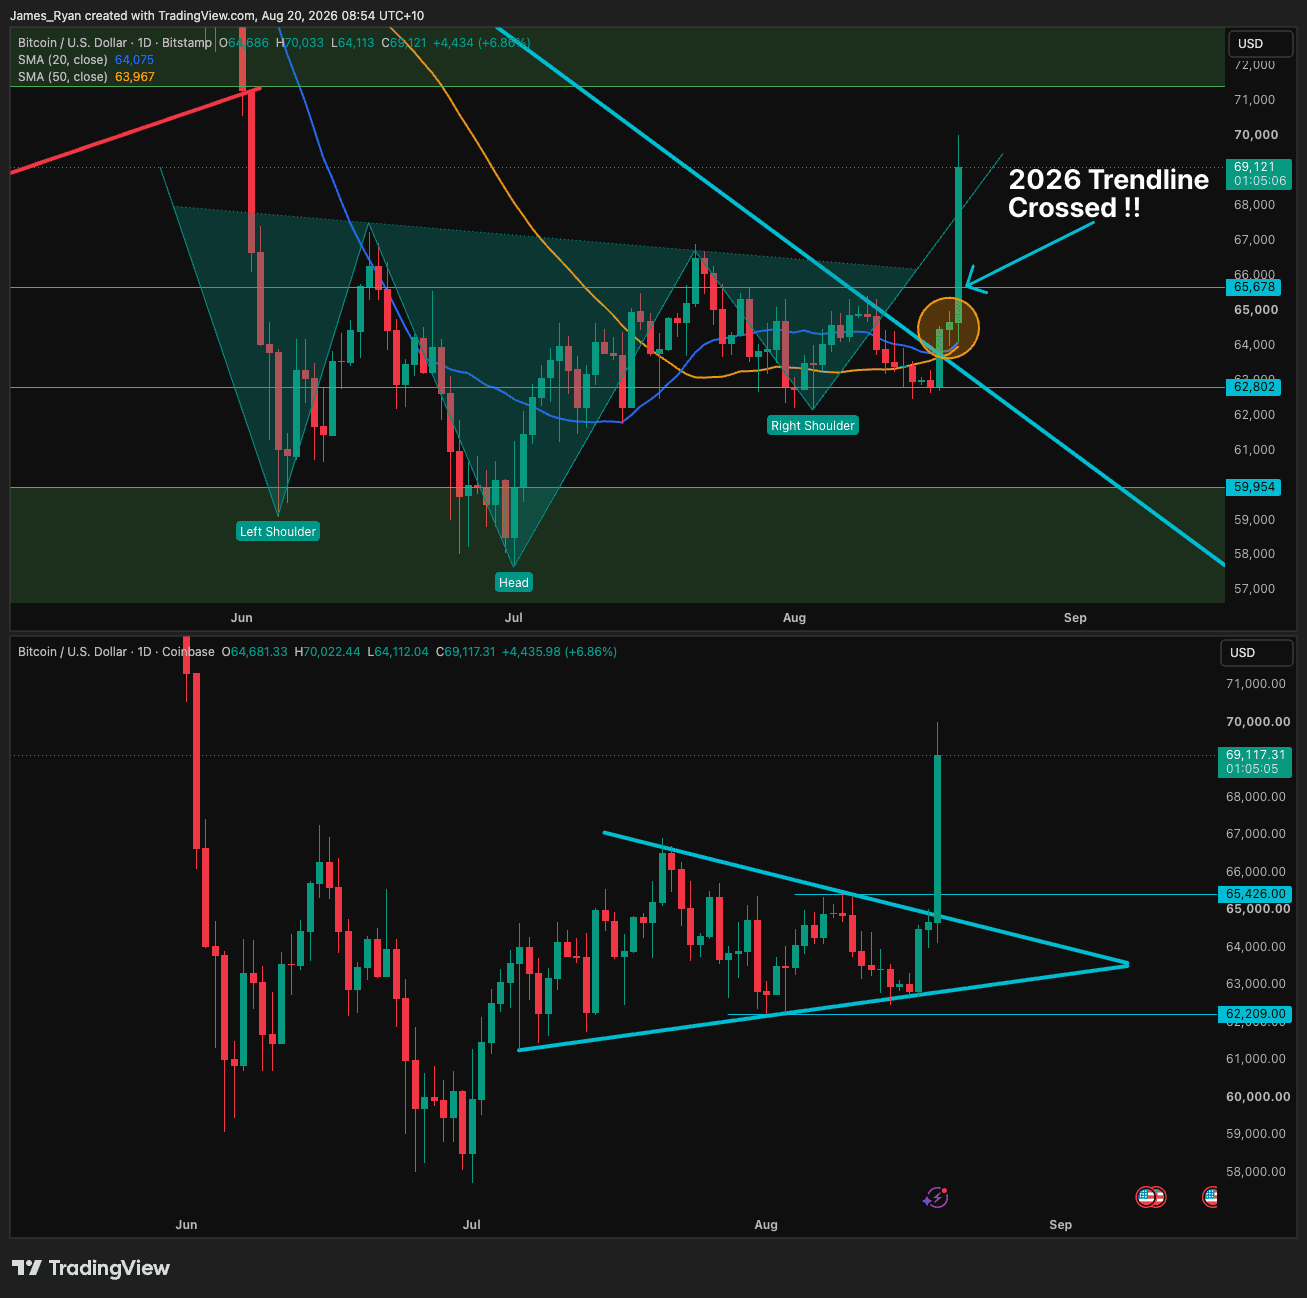
There’s genuinely bullish price-action on the charts this week. Bitcoin has begun crossing the 2026 bear market trend line we’ve been tracking with clients for months - the descending line connecting every lower high since October’s peak. For the first time since this bear market began, Monday’s daily close popped through it, and yesterday’s close held above it too - now we just launched above it. Historically, that high volume cross has meant something specific: once a Bitcoin bear market trend line breaks, the bottom is already in, and price has never gone back below the recent lows.
The daily chart backs this up structurally as well as a textbook inverse head and shoulders has formed since June. Monday’s candle broke straight through the trend line and just blew past the neckline resistance ~ $65,000. On the shorter timeframe, price had been compressing inside a symmetrical triangle for weeks, and that Monday buying candle is exactly the kind of decisive move triangles like this eventually resolve with, which you’re now seeing today.