As people unwrap their gifts this holiday season, it's time to reflect on a year that didn’t go as many had hoped. While Bitcoin is likely to close 2025 in the red, it has been far from a wasted year. Quiet wins, foundational progress, macro shifts have quietly taken shape and may set the stage for what comes next. Compared to many other assets, Bitcoin may now be undervalued, not just relative to its own history, but within the broader macro environment.
Rather than the usual monthly Rake Review, we’re taking a deeper dive into the year that was.
January: Trump Returns
One of the biggest stories from 2024 became reality in January as Donald Trump was officially inaugurated and returned to the White House. The bullish sentiment surrounding his return saw risk on assets push higher, with Bitcoin setting its first all time high of the year just shy of $110K.
Optimism spread quickly. Trump introduced the Crypto Task Force within the SEC and Gary Gensler stepped down as chair. He was replaced by Paul Atkins, a long-time critic of Gensler's anti-crypto stance and far more favourable towards the space.
February: The Month of Rumours
The bullish tone continued, but headlines shifted. February was dominated by speculation and two major narratives emerged. First, rumours surrounding sweeping new tariffs from Trump's economic agenda began to circulate and started to weigh on risk markets. Second, the idea of a Strategic Bitcoin Reserve began to build. It was still unconfirmed, but momentum was growing.
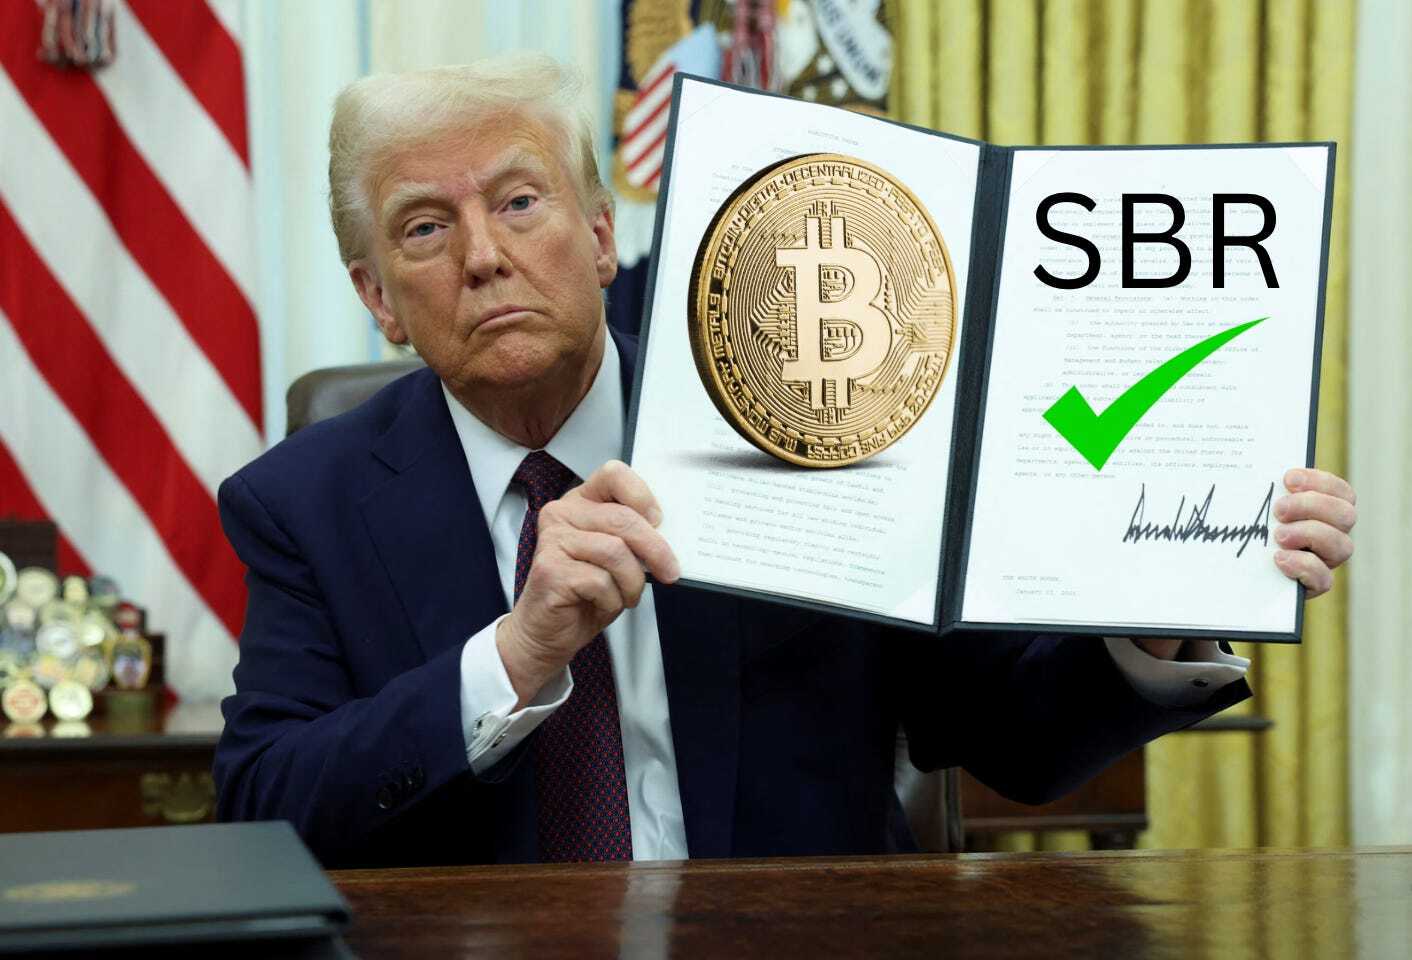
March: Strategic Bitcoin Reserve Confirmed
March may go down as one of the most important months in Bitcoin’s history. The US Government officially announced the creation of a Strategic Bitcoin Reserve. While Bitcoin had previously been adopted by countries like El Salvador and Argentina, the involvement of the US brought a level of legitimacy the space had never seen.
This move did not just validate Bitcoin to institutions and retail investors. It integrated Bitcoin into global government strategy.
April: Markets Liberated
Tariff speculation finally turned into reality. April 3 became known as Liberation Day. Trump announced tariffs on 185 countries, with a base 10 % applied to most and higher rates for others. The result was a broad selloff across markets. Bitcoin fell to $75K and the S&P 500 also posted its yearly low.
The fear was short lived. Markets rebounded and Bitcoin kicked off a seven week bullish streak.
May: Sell in May and Go Away?
That phrase has been passed around for years, but it did not apply in 2025. Bitcoin extended its rally and set a new all time high at $112K. This came as US debt surged past $37 trillion and confidence in the traditional system continued to erode. Investors rotated out of the dollar and into hard assets, with Bitcoin one of the biggest beneficiaries.
June: Middle East Conflict
Just as momentum was building, geopolitical tensions flared. Conflict between Iran and Israel rattled risk markets. A brief pullback followed, but it did not last long.
By the end of H1, Bitcoin was up over 15 % for the year, the S&P 500 had gained 5.5 %, gold was up 26 % and silver had climbed 25 %.
July: Regulatory Wins and Momentum
With conflicts easing and tariffs temporarily paused, July saw another push higher. Bitcoin hit a new all time high at $123K.
The month was also defined by major wins on the regulation front. The first Crypto Week was held in Washington and three key bills passed through Congress — the GENIUS Act, CLARITY Act and Anti-CBDC Act. The GENIUS Act was signed into law, providing stablecoin regulation and clearer crypto guidelines. While not directly tied to Bitcoin, it gave broader confidence to the entire crypto space.
The first whispers of altseason began to surface.
August: Ethereum Runs and Executive Order Signed
Momentum carried through into August. Bitcoin pushed just above July’s high at $124K, but this time it was Ethereum that took centre stage.
Institutional accumulation was the dominant narrative. Spot ETF flows into ETH were at their highest since launch. Ethereum reached a new all time high just shy of $5,000, its first in nearly four years.
Another big win for Bitcoin came with an executive order that allowed digital assets to be included in 401K retirement accounts. A major step forward for adoption in the US.
September: Rate Cuts and Decentralised Momentum
September has historically been Bitcoin’s worst month. In 2025, price held steady, setting up a potential fourth quarter rally.
DeFi took the spotlight. Decentralised exchanges hit record volume. Hyperliquid continued to dominate until Aster arrived and quickly became a serious competitor.
Macro-wise, the US saw its first rate cut of the year. Signs that quantitative tightening was coming to an end, and liquidity was starting to return. A key turning point for risk markets.
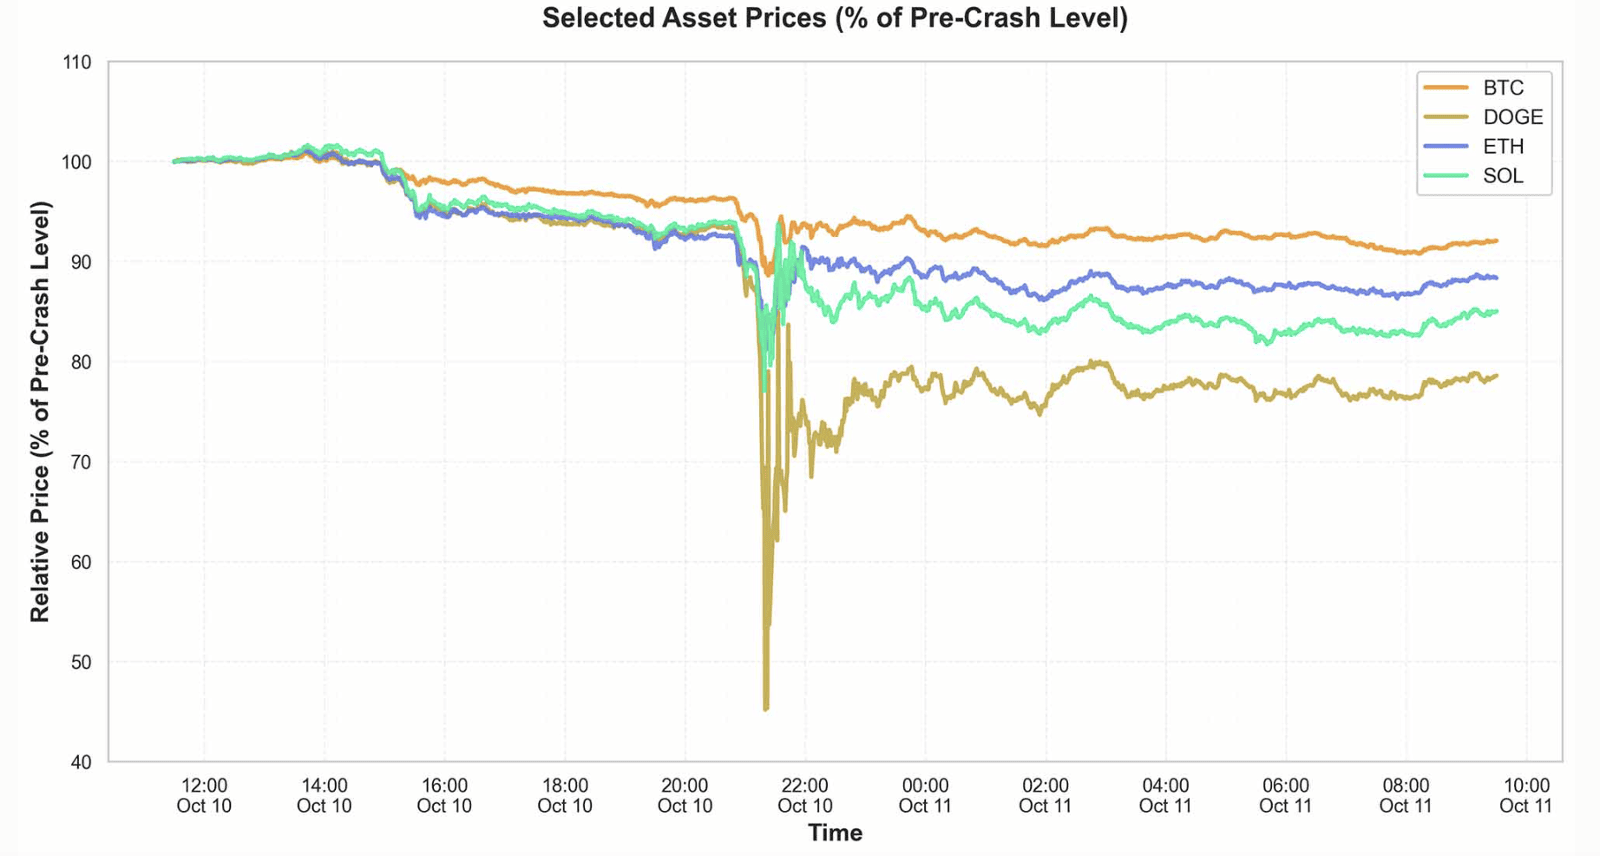
October: New High and the 10/10 Crash
The month began with strength. Bitcoin hit a new all time high at $126K in the first week.
Then came October 10.
Trump issued a surprise tariff threat on China, this time at 100%. Markets sold off sharply. A stablecoin depegged on Binance, market makers were caught offside and Bitcoin crashed from $117K to $102K. Some altcoins dropped more than 80 % in less than 30 minutes.
Close to $20 billion was wiped in liquidations. Since then, Bitcoin has fallen over 30 % and is now red on the year. Meanwhile, the S&P 500 has recovered and gone on to set new highs.
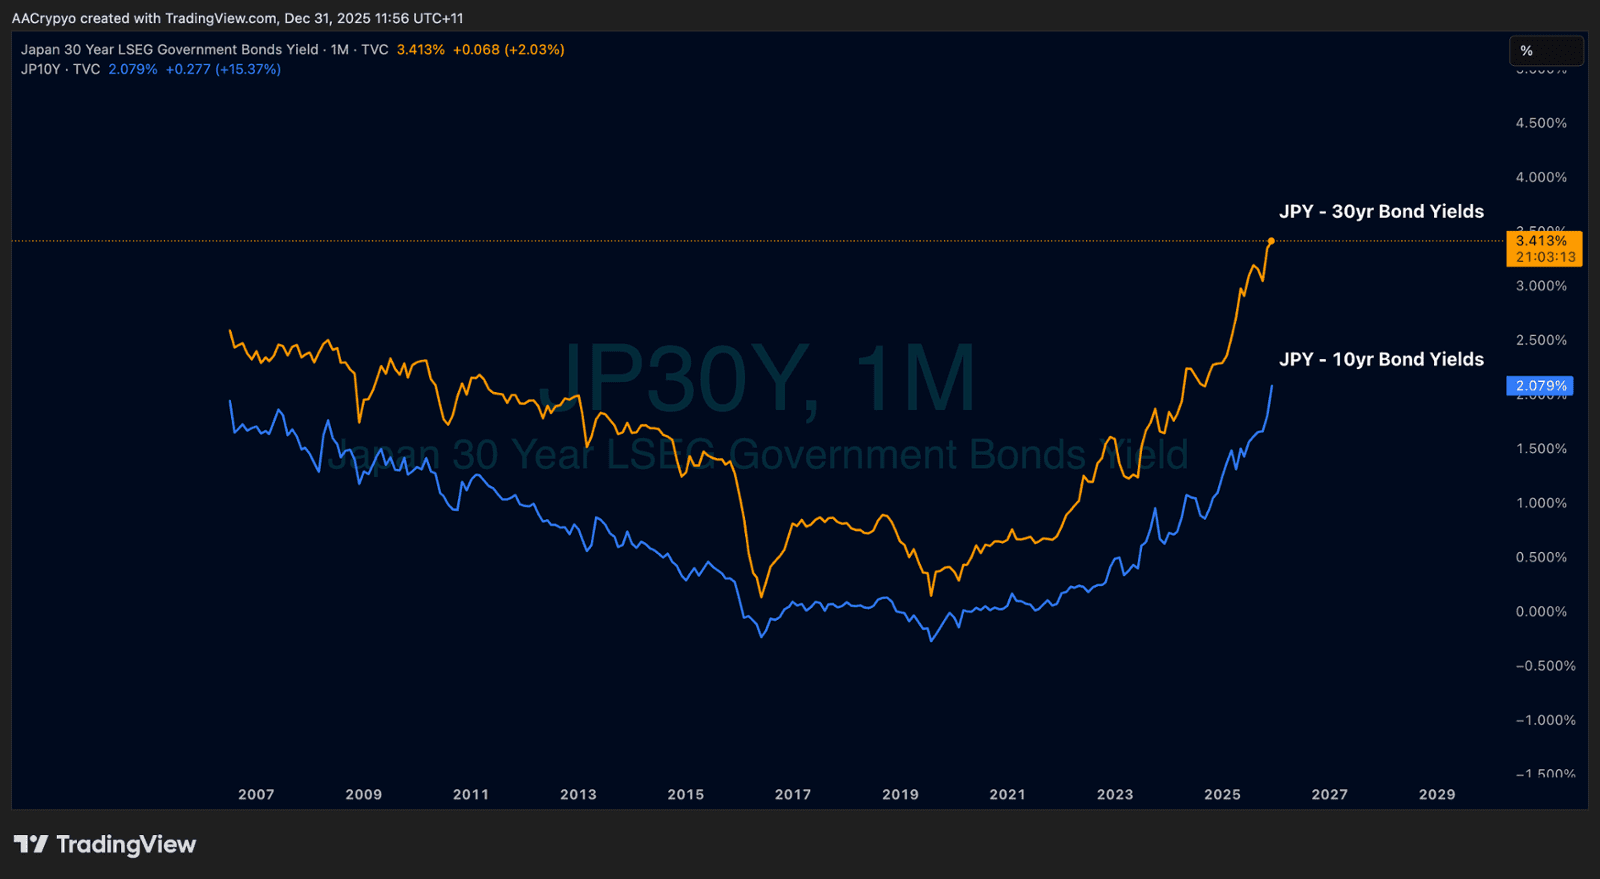
November: Yen Pressure Returns
The main story in November was once again Japan. Last year, it was a surprise rate hike. This year, it was surging bond yields that triggered another potential unwind of the yen carry trade, with both the 10-year and 30-year yields hitting their highest levels since the turn of the century.
Rising borrowing costs forced institutions to exit risk on positions, including crypto. Bitcoin came under pressure as a result.
Still, there was a silver lining. The US Federal Reserve officially announced the end of quantitative tightening. It did not spark a rally, but it laid the groundwork for future expansion.
December: Metals Take the Lead
Bitcoin was flat in December, with little interest in risk. The Fed cut rates, the BOJ raised them, and the effects cancelled each other out.
Instead, all eyes were on commodities. The Fed announced it would begin buying $40 billion in Treasuries. The first taste of quantitative easing. Gold continued to climb to new highs on daily closes, and silver surged 45 % for the month.
Bitcoin sat idle. But historically, metals lead the way and risk follows. That rotation may arrive early in 2026.
What Does This Mean for 2026?
There is no hiding from the fact that Bitcoin has underperformed in 2025. But it was a year of progress, development and structural change.
We saw:
Multiple all time highs
The creation of the Strategic Bitcoin Reserve
Pro crypto legislation signed into law
A crypto friendly SEC and White House
Expanded access to Bitcoin through retirement plans
The end of tightening and early stages of monetary easing
All of this came alongside a red year for Bitcoin and currently 30% down from its all time high. Expectations are more grounded going into 2026. No calls for blow off tops or vertical rallies. But given the policy backdrop and recent correction, Bitcoin looks far closer to a bottom than a top. The groundwork has been laid throughout the year, and whilst not reflected in the price performance of Bitcoin, it has been invaluable for the long term health and performance for Bitcoin…
At current levels, it is fair to say Bitcoin is undervalued.
Stormrake 2026 Bitcoin Thesis:
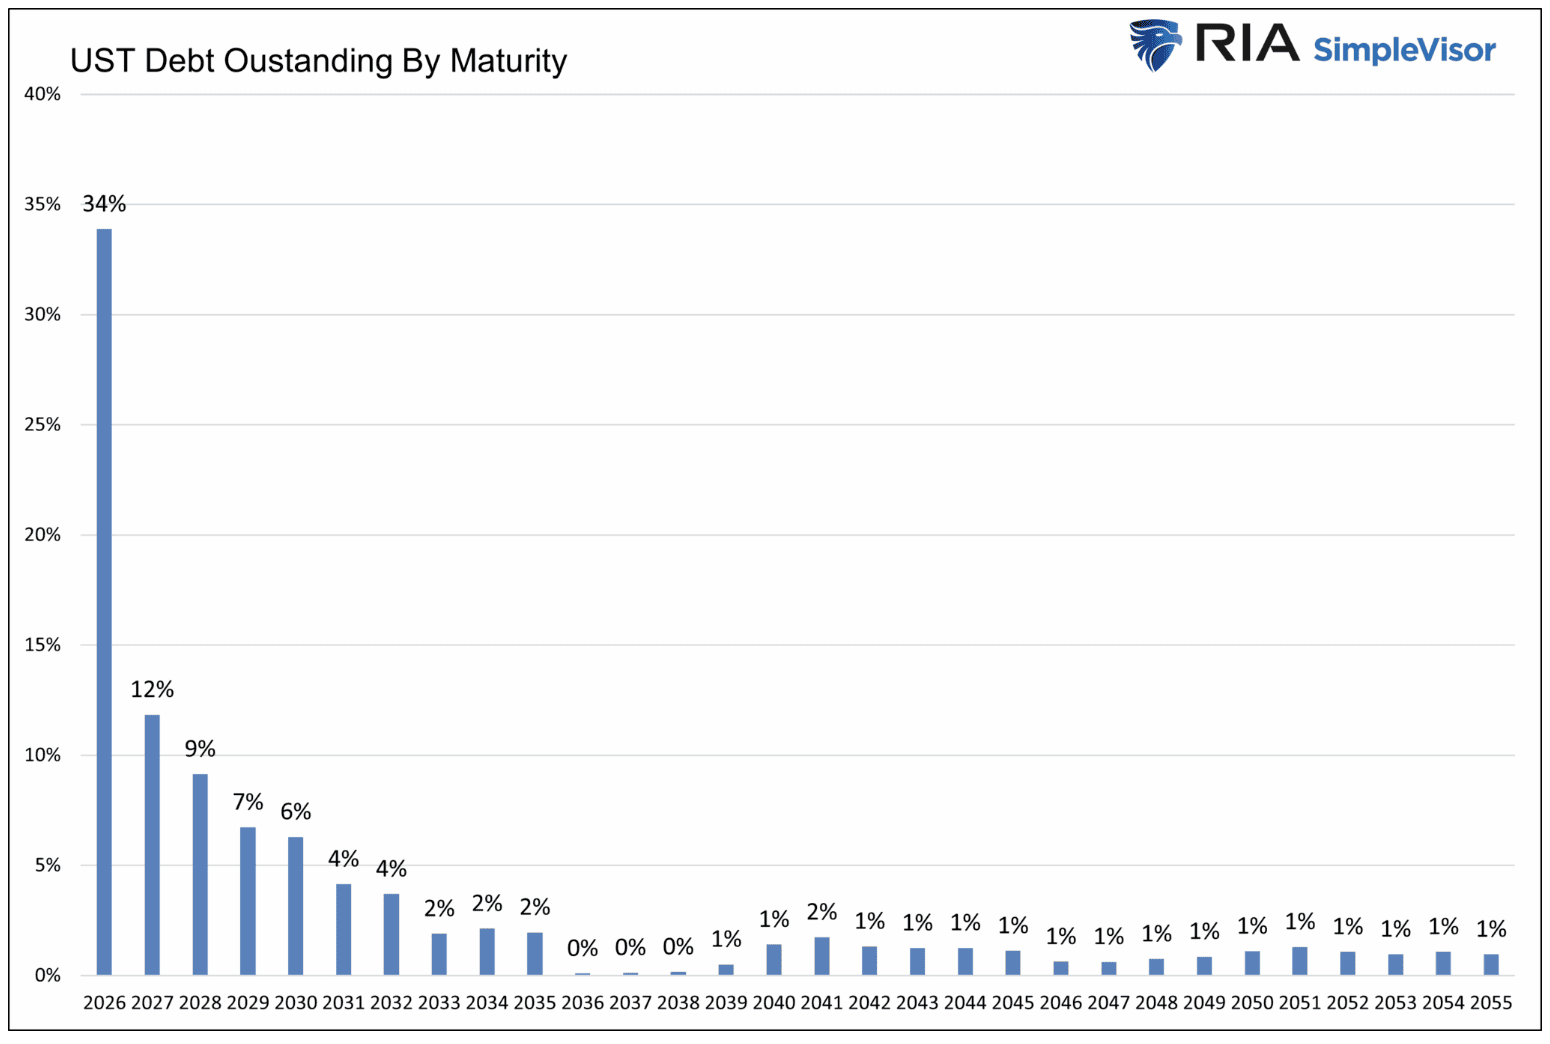
Stormrake expects Bitcoin to trade materially higher in 2026, with a base case range of $180,000 to $250,000. The drivers are not speculative narratives, but balance sheet stress, sovereign refinancing pressure, and structurally limited supply.
Roughly $7 trillion in US debt matures in Q1 (and over a third of all US debt to mature in 2026). It must be refinanced at meaningfully higher yields, pushing interest expense near defence-level spending. Policy is no longer about inflation or employment. It is about fiscal survival. Bitcoin benefits not from collapse, but from visible refinancing stress and the constraints it places on monetary tools.
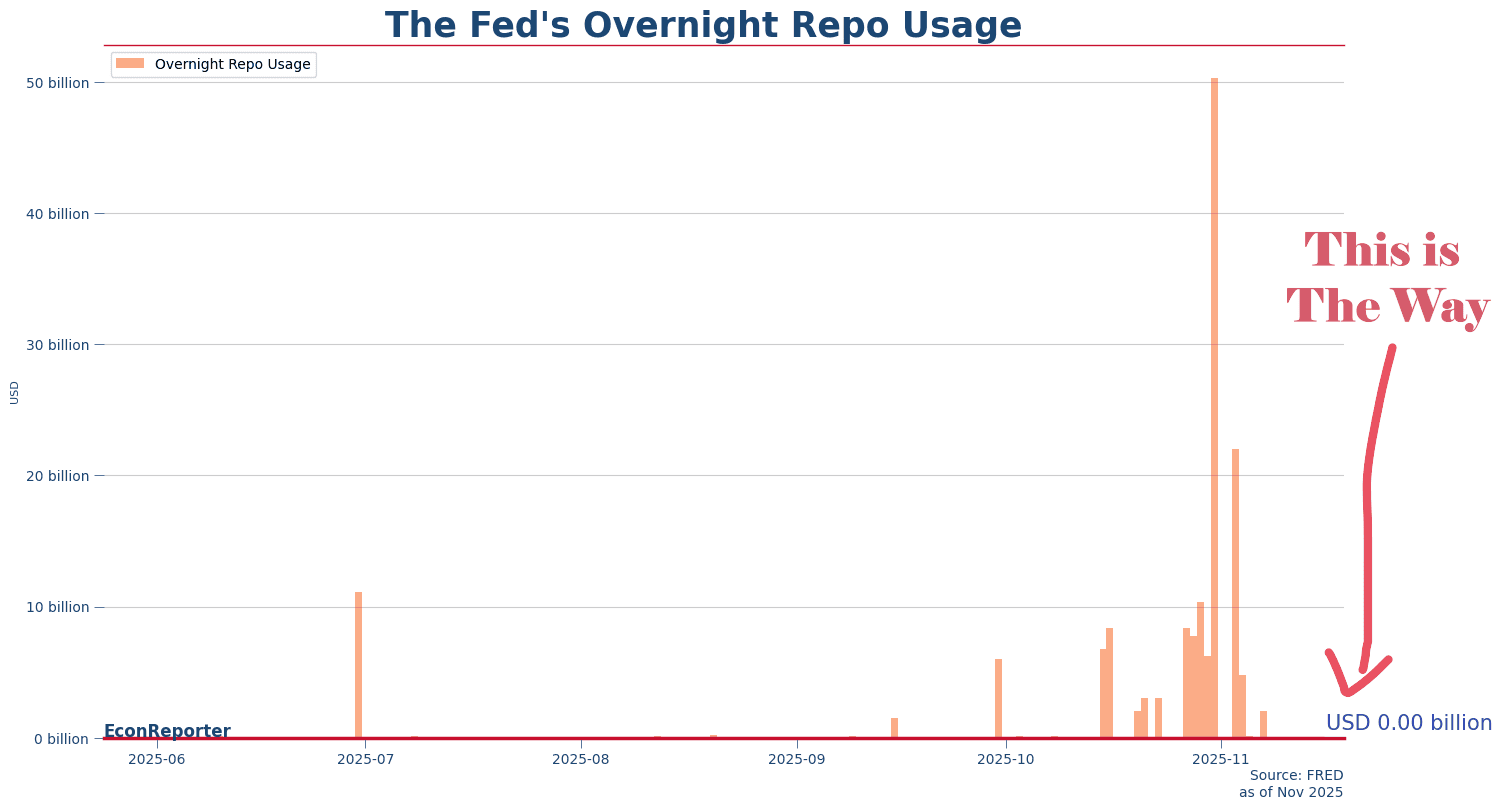
Liquidity is returning, not through headline QE, but quietly via repo facilities, yield curve interventions, and regulatory nudges. The Fed is already injecting billions through overnight repo. That liquidity is flowing into scarce assets. Bitcoin absorbs it faster each cycle.
Post-halving supply is negligible. ETF flows are steady. Institutions are allocating gradually.
Corporate treasuries and long-term holders are reducing float. 2026 is not about euphoria. It is about absorption.
Risks remain. A failed Treasury auction, prolonged high rates, or renewed regulation can delay upside. But in every stress case, the long-term thesis holds. Bitcoin is not pricing perfection. It is pricing policy distortion and fiscal constraint.
Bitcoin in 2026 is not competing with tech stocks or altcoins. It is competing with sovereign credibility. Volatility is the cost. Scarcity is the payoff.
Video of the month:
Michael Saylor Keynote | Bitcoin MENA 2025
Education: Beyond Price: On-Chain Metrics That Matter
Most Bitcoin investors only look at price as a way to measure value and decide whether to enter or exit a position. But there is much more to Bitcoin than just price, especially when it comes to evaluating where we are in the cycle. This is where on-chain data comes in, helping to assess Bitcoin’s true value based on investor behaviour, holding patterns and capital flow.
Here are three of the key on-chain metrics we use to better understand Bitcoin's value. Each provides a different lens on sentiment, valuation, and cycle timing.
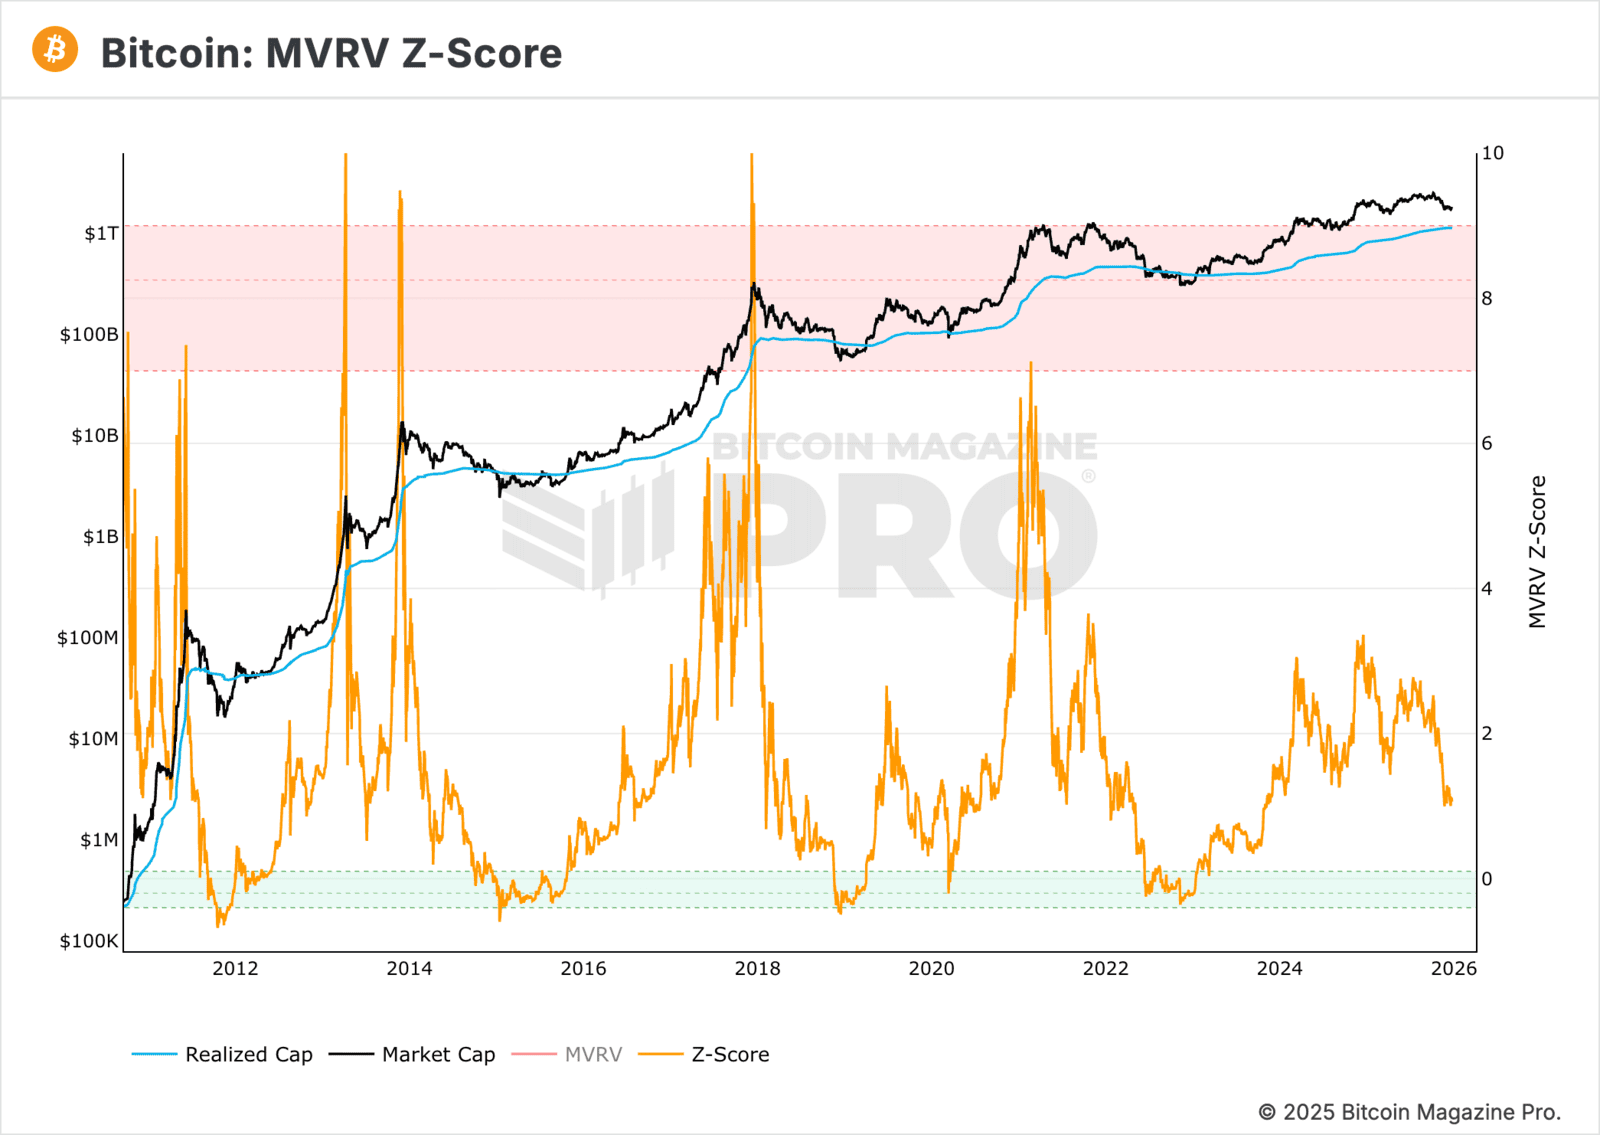
MVRV Z-Score: Market Value to Realized Value
MVRV Z-Score is a chart that uses blockchain data to highlight when Bitcoin is significantly over or undervalued compared to its historical fair value.
It’s based on three components:
- Market Cap (black line)
- Realised Value (blue line), not the current Bitcoin price. This is calculated by taking the price at which each Bitcoin last moved (wallet to wallet), then averaging those prices and multiplying by the total circulating supply
- Z-Score (orange line), a standard deviation measure that identifies extreme differences between Market Cap and Realised Value
On the chart, the green band near ~0.10 represents undervaluation and typically aligns with cycle bottoms. The red band around ~7 indicates overvaluation and has historically marked cycle tops. When Bitcoin enters either band, a top or bottom has usually followed within two weeks.
Right now, the Z-Score sits below 1, signalling that Bitcoin is undervalued and still trending lower. If the price continues to drop, the Z-Score will likely follow. Should it enter the green band, this would suggest a bottom is near and historically has offered generational accumulation opportunities.
Short Term Holder Realised Price:
Understanding Sentiment Through Recent Buyers
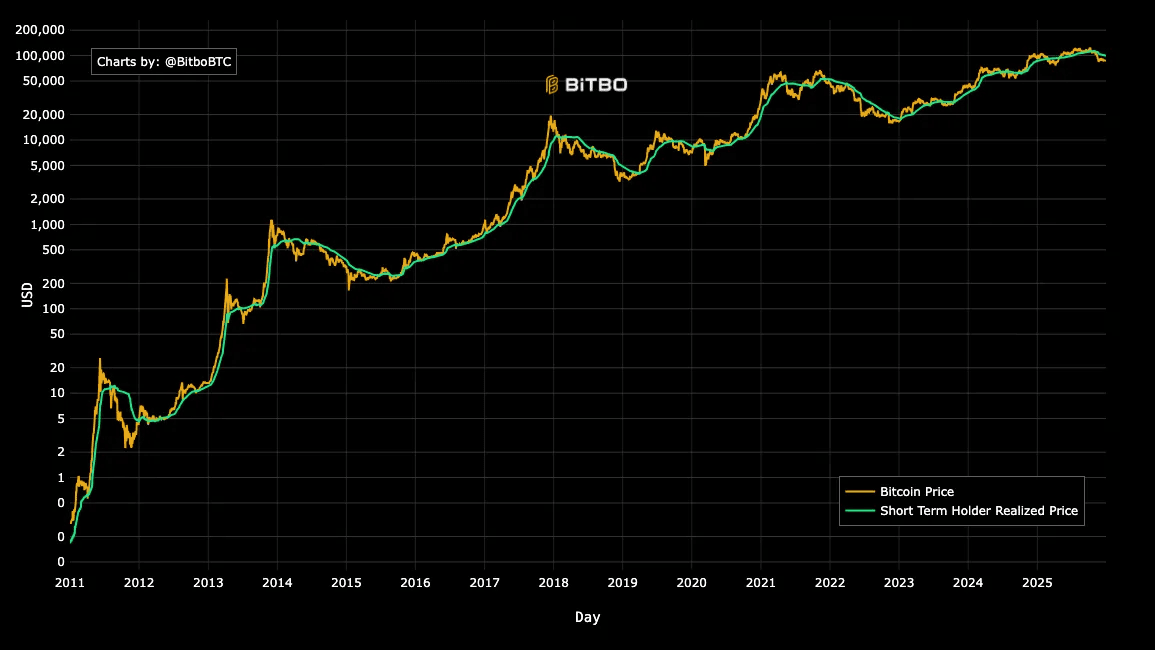
This metric reflects the average price that Bitcoin has been moved on-chain within the past 155 days. Anyone holding Bitcoin for less than 155 days is considered a short term holder.
Short term holders are more reactive to market volatility. They are more likely to sell during corrections and are typically driven by short term sentiment. This metric gives us a clear picture of whether recent buyers are in profit or in drawdown.
The chart shows Bitcoin price (yellow line) against the short term holder realised price (green line). When price is above the STH realised price, it indicates a bullish market as these holders are in profit. When price is below, it signals bearish sentiment as they are in loss.
Currently, the STH realised price sits around $99.7K, while Bitcoin is trading at $87K. That gap highlights a clear sentiment shift. Short term holders are under pressure, which explains the weak price action and overall bearish tone.
This metric is not only useful for sentiment. It also often acts as a dynamic support or resistance level during different phases of the cycle.
Tracking Smart Money Accumulation and Distribution
Long term holder supply refers to the total Bitcoin supply held by wallets that have not moved their coins for at least 155 days.
In the chart, Bitcoin price is shown by the orange line, and long term holder supply is represented by the green area. This metric helps us see when long term holders are accumulating or distributing their coins, and it usually leads price action.
Long term holder supply tends to peak just before Bitcoin price tops. This is when early investors begin distributing. It also tends to bottom around Bitcoin’s price peak, as new long term holders accumulate during bear markets. An increase in long term holder supply after a correction typically signals the early stages of a new cycle.
Currently, LTH supply sits around 14.1 million, the lowest since 2021, after peaking in June. That peak occurred just months before Bitcoin’s current all time high at $126K. If this supply begins to increase again, it would confirm that the cycle top is in, and accumulation is once again underway.
These are just three of many useful metrics that go beyond simple price analysis. Together, they help identify whether Bitcoin is undervalued, measure market sentiment, and give clues as to where we are in the cycle.
As it stands:
- MVRV Z-Score suggests Bitcoin is undervalued
- STH Realised Price shows short term sentiment is bearish
- LTH Supply points to a potential cycle top already in
All three tell a story that Bitcoin may be in a bottoming phase. These metrics should be tracked regularly as they are often early signals of where Bitcoin could go next.
Written by Alexandar Artis
Start Your Brokerage Account
If you enjoyed this Rake Review, feel free to open an account and gain access to more proprietary research and work with your very own dedicated crypto broker.
No Advice Warning
The information in this newsletter is general only. It should not be taken as constituting professional advice from the author - Stormrake PTY LTD.
Stormrake is not a financial adviser and does not provide financial product advice. You should consider seeking independent legal, financial, taxation or other advice to check how the information relates to your unique circumstances. Stormrake is not liable for any loss caused, whether due to negligence or otherwise arising from the use of, or reliance on, the information provided directly or indirectly, by this newsletter.
Disclaimer
All statements made in this newsletter are made in good faith and we believe they are accurate and reliable. Stormrake does not give any warranty as to the accuracy, reliability or completeness of information that is contained here, except insofar as any liability under statute cannot be excluded. Stormrake, its directors, employees and their representatives do not accept any liability for any error or omission in this newsletter or for any resulting loss or damage suffered by the recipient or any other person. Unless otherwise specified, copyright of information provided in this newsletter is owned by Stormrake. You may not alter or modify this information in any way, including the removal of this copyright notice.
Copyright © 2022 Stormrake Pty Ltd, All rights reserved