November Brought Bearish Price Action but Macro Tailwinds Are Building
November Brought Bearish Price Action but Macro Tailwinds Are Building
November Brought Bearish Price Action but Macro Tailwinds Are Building

Just last month we saw all time highs. Now, one of Bitcoin’s largest buyers has paused its accumulation, bear market signals have triggered, and sentiment has turned. But despite all of this, several key factors suggest this market may be fundamentally different from those we’ve seen before.
Bitcoin Enters a New Macro Era
Since Bitcoin's inception it has followed a recurring pattern centred around the halving events, commonly referred to as the four year cycle. Historically this cycle has consisted of three years of bullishness followed by one extreme year of a bear market, often marked by an 80% drawdown. But this time, it is different?

New fundamental drivers that were not present in previous cycles have changed the structure entirely. Relentless buying from newly launched spot crypto ETFs, the emergence of Bitcoin treasury strategies from corporates, and most importantly sovereign accumulation of Bitcoin as a strategic reserve asset have all supported the bullish phase of this cycle. These factors are the reason many are starting to question whether the four year cycle is still relevant.
However, those who focus on historical signals still have reason to believe the cycle remains intact.
We are now exactly 36 months from Bitcoin's last cycle bottom, which lines up with previous timeframes. Bitcoin has retraced over 30% from its all time high, ETF inflows have slowed, and MicroStrategy has ended its six week Bitcoin buying streak.
The big question now being asked across the market is simple, how low can Bitcoin go?
Classic bear market signals have reappeared. Historically these have marked the beginning of prolonged drawdowns and crypto winters. Bitcoin's near 30% retrace from its October high has triggered a collapse in sentiment. Retail investors have begun panic selling at a loss after buying earlier in the year.
The Fear & Greed Index has remained in extreme fear territory for almost the entire month, with only a couple of short lived breaks above it. This level of sustained pessimism has only been seen a few times before, mid 2022 after Luna collapsed, mid 2021 during a 50% retrace from all time highs, and the March 2020 Covid crash when Bitcoin was at $3K.
While fear dominates the market, this is often where the greatest opportunities lie. For those who understand the fundamentals and look past short term price movements, the current environment looks less like the middle of a bear cycle and more like a major setup for the next move higher. Structural forces are now more relevant than cycle theory alone.
Bitcoin is an asset that thrives on liquidity. It performs best when money is flowing into the economy and people are spending. That happens when interest rates are low or when monetary stimulus returns. So far this year the US has only delivered one rate cut, fewer than most had anticipated. Markets are now pricing in a second cut in December which would bring the 2025 total to two.
Looking ahead to 2026, current probabilities give a 65% chance of at least three cuts next year. Lower borrowing costs would bring more liquidity to the system, which is supportive for Bitcoin.
Interest rates are only one part of the equation. The Federal Reserve also has a major influence through its balance sheet policies. Quantitative tightening drains liquidity from the market and generally weighs on risk assets. Easing does the opposite. Since June 2022 the Fed has been in a tightening phase but as of December 1 that has officially ended. While easing is not expected to begin immediately, the pivot has started and 2026 could see that shift begin in full.
Despite this tightening regime Bitcoin has performed strongly since mid 2022. A shift back to easing would only accelerate the next phase of growth.
These two macro drivers, increasing liquidity and looser monetary policy into 2026, are likely to shape the path ahead. The question now is which narrative will win out: the historic four year cycle or the fundamentally driven macro regime that is now taking centre stage?
The Hidden Hands Moving the Market
The Hidden Hands Moving the Market
For most of Bitcoin’s life governments and large institutions were openly against it. It traded on its own path, following its own internal cycle, as mentioned earlier. But as the asset has matured, it has become increasingly tied to traditional markets and more sensitive to the influence of macroeconomic and political events.
As many of you already know, this year’s price action has been heavily shaped by macroeconomic forces, central bank decisions, and institutional positioning. From the US government’s creation of a Strategic Bitcoin Reserve to rising global trade tariffs and geopolitical tensions, external factors are no longer just noise, they are core drivers. But this month, we saw a return of something that had not impacted markets for over a year: the US government shutdown.

The longest government shutdown in US history is now over. What began in September ended this month in November, and once again it disrupted broader markets, including Bitcoin. During the 43 day shutdown, several key government functions were suspended. The Bureau of Labor Statistics was unable to release critical economic data, leaving the Federal Reserve without the information it typically relies on to guide interest rate decisions. That kind of uncertainty causes hesitation among policymakers and creates nervousness in markets. For assets like Bitcoin, which historically struggle during periods of uncertainty, the effects were felt almost immediately.
The shutdown also had a direct impact on the Treasury General Account, which is responsible for distributing government funds. Between 60 to 70 million Americans were affected, including those receiving food stamps, government contractors, and essential workers. The lack of distributed funds meant that many households were forced to sell assets to meet basic needs. With over $1 trillion sitting idle in the TGA, this disruption removed a major source of liquidity from the market.
Many new investors might overlook the connection between political gridlock and market performance, but these events play a much larger role than most realise. And it is not just the United States driving these dynamics. Japan is just as critical, if not more so, to the global risk asset trade.

Japan is widely seen as the cheap credit engine of the global economy. Institutional investors including banks, hedge funds, and asset managers often borrow yen at ultra low interest rates to invest in higher yielding assets elsewhere. This is known as the Yen Carry Trade. It works as long as interest rates in Japan remain low and bond yields do not rise. But when those yields start climbing unexpectedly, it increases the cost of borrowing, and the trade begins to unwind.
We saw this carry trade unwind mid last year, and signs of it have reappeared this month. During the last unwind Bitcoin dropped 30% as institutions rapidly sold assets to cover yen liabilities. This month Japanese bond yields moved higher again, triggering a similar reaction. That unwinding pressure has been a major driver behind Bitcoin’s poor performance in November.
Both the US shutdown and the yen carry trade are examples of structural market dynamics that most retail investors miss. These are the kind of headlines that many gloss over, without realising how deeply they affect Bitcoin’s price. So while many are focused on the daily chart or waiting for a bounce, the real pressure is coming from much higher up the chain.
November Falls Flat as December Takes the Spotlight
November Falls Flat as December Takes the Spotlight
November has historically been Bitcoin's strongest month for average returns, coming in at 40.5% over the last 14 years. But this time around, it did not live up to the hype. Instead of another blockbuster close, Bitcoin finished the month down 17.5%, its second worst November in the last 15 years.
Not only did November close red, but the drawdown also flipped Bitcoin negative for the year. That outcome would have been unthinkable to most if you told them at the start of 2025. The shift has caught many off guard and added another layer of pressure to December.
So now the focus turns to December, and whether it can break the streak of red months, close the year green, and give bulls some momentum heading into 2026. Historically December has delivered an average return of 8.42%, but it has been more of a coin flip in reality, with only seven out of the last fourteen Decembers closing green.
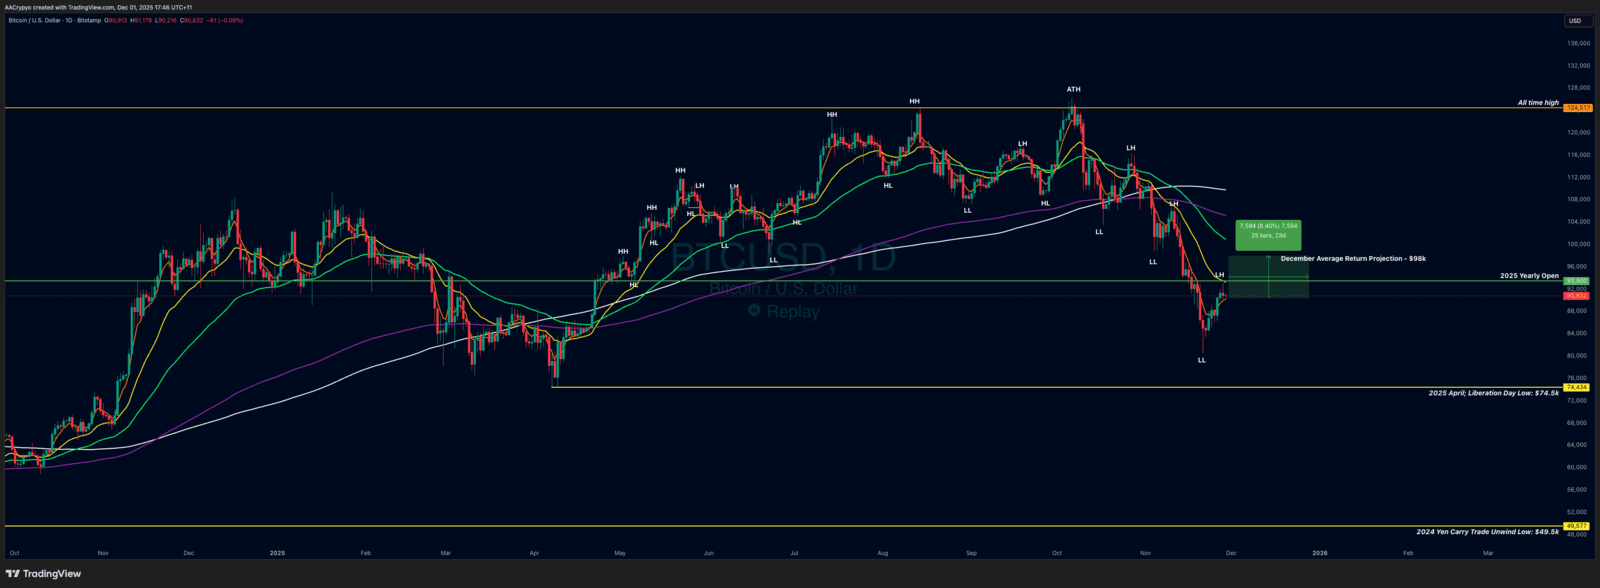
The chart above highlights the current technical outlook. November only compounded the bearish structure that took hold in October. Bears remain in control of both momentum and market structure, driving lower highs and lower lows and pushing Bitcoin back to levels not seen since April.
From an open just under $110K, Bitcoin dropped as low as $80K and closed at $90K. That kind of range reinforces the idea that this is still a market under pressure. Even if we apply December’s historical average return to current price action, Bitcoin would close the year around $98K, enough to flip 2025 green, but likely not enough to reverse the broader bearish structure or momentum trend.
So for bulls to take back control, it would take a clear breakout and performance that exceeds the historical average.
If the bears remain in charge, we could easily retest April’s yearly low at $74.5K, a level hit on Trump’s Liberation Day earlier this year. That remains a key line to watch on the downside.
December will also be a major month in the macro space. All eyes are on the US Federal Reserve and the Bank of Japan, both of which have the power to move markets in either direction. The Fed will decide on interest rates on December 10, with current odds showing an 88% chance of a 25 basis point cut. That move is likely already priced in but would still be supportive for Bitcoin.
The Bank of Japan is also in focus due to rising yields and the potential unwinding of the yen carry trade. Current probabilities give a 53% chance of no change and a 47% chance of a 25 basis point hike. The last time we saw an unexpected hike from the BOJ, the yen carry trade unwound and Bitcoin dropped 30% within a week.
Both central banks will play major roles in shaping December’s market conditions, and Bitcoin will be reacting to every move.
In the News:
In the News:
Strategy May Consider Selling Bitcoin:

One of the most well known Bitcoin bulls, Michael Saylor's company Strategy, may now be facing pressure to make a decision that was once considered off the table. CEO Phong Le has stated that the firm would consider selling some of its Bitcoin, but only as a last resort.
This would only happen if Strategy’s stock (MSTR, market cap $50.9B) trades below a 1x multiple of its Bitcoin Net Asset Value, currently sitting at 1.19, and if the company fails to attract fresh capital.
The multiple could fall if Bitcoin's price drops significantly or if MSTR underperforms, causing markets to value the company below the worth of its Bitcoin holdings. While this scenario is not imminent, the fact that selling is even being mentioned marks a notable shift in tone from one of Bitcoin’s most vocal corporate backers.
Japanese Bond Yields Hit Multi-Decade Highs:

The yen carry trade works because of ultra cheap borrowing costs in Japan. But when those costs rise, especially unexpectedly, it forces institutions to unwind the trade by selling risk assets and repaying yen.
In November we saw exactly that. Long term Japanese bond yields surged, with the 10 year yield rising nearly 9% to its highest level since mid 2008. The 30 year yield rose 10% to reach an all time high.
This rapid rise has made borrowing more expensive and triggered early signs of another potential carry trade unwind. As noted earlier, a similar unwind last year led to a sharp 30% drop in Bitcoin as institutions liquidated positions.
December will be a critical month in this story, with both the Bank of Japan’s rate decision and possible currency intervention playing major roles in whether the unwind accelerates or gets delayed.
BlackRock’s IBIT Becomes the Most Successful ETF in History:
BlackRock was once firmly against Bitcoin. Now, less than two years after launching the IBIT Bitcoin Spot ETF, it has become the most successful ETF launch in history and BlackRock’s most profitable ETF product.
IBIT not only broke the record for the largest inflows in its first month, but by October 2025 it was generating an estimated $245 million in annual fees. It has now grown to hold over 3% of Bitcoin’s total supply.
This shift from active opposition to full scale adoption underscores how far institutional acceptance has come and how ETFs have become one of the most powerful forces in Bitcoin’s current cycle.
Market Update:
Market Update:
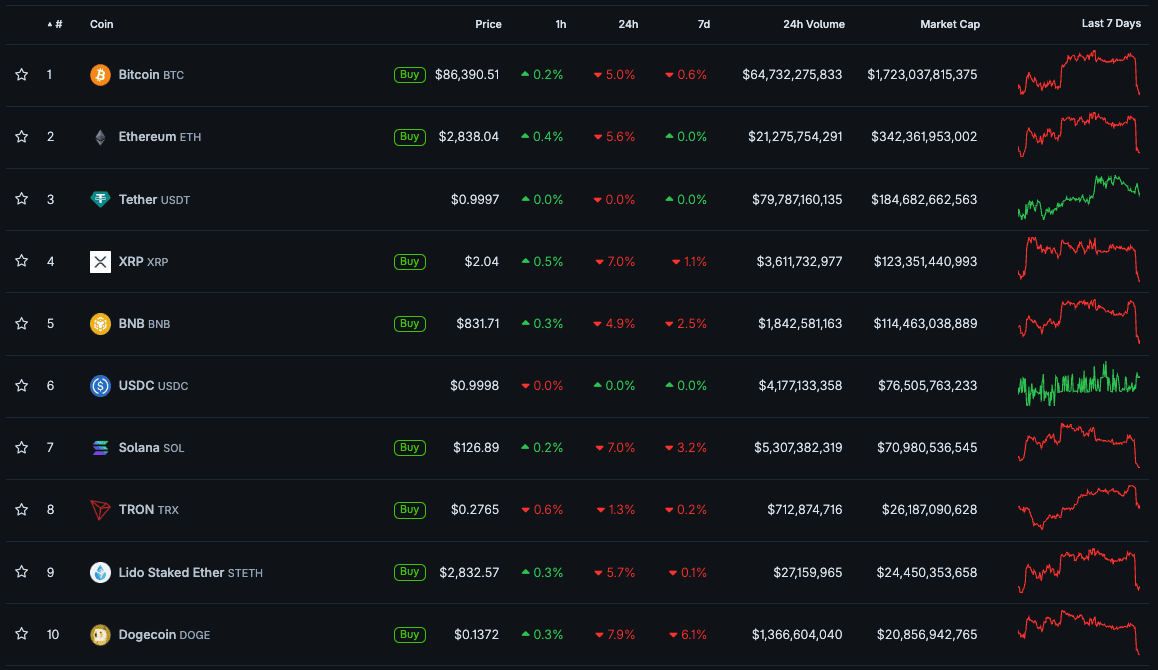
Here is the fast five of what you need to know about the market in November 2025:
- Bitcoin fell 17.5% in November
- Ethereum fell 22.2% in November
- Solana and Tron both jumped in their rankings, SOL from seventh to sixth and TRX from tenth to eighth
- PAXG was a standout, up 6.1% when the majority of the market was red
- The total crypto market cap fell by 16.80%
Video of the month:
Saifedean Ammous Bitcoin Amsterdam 2025 Keynote Speech
Education: How Japanese Monetary Policy Impacts Bitcoin
We’ve spoken about how crucial Japanese yields, interest rates, and the yen carry trade are to Bitcoin, but how correlated are they really? Let’s take a closer look.
The relationship between Bitcoin and Japanese bond yields is quite a unique one. In the short term, the correlation tends to be negative. When yields spike suddenly, Bitcoin often sells off. But over the long term, across multi quarter and multi year periods, the trend flips positive.
If you zoom out and compare them since 2020, both Bitcoin and Japan’s 10 and 30 year bond yields have been moving higher overall. That shows a clear long term correlation. However, there have been specific periods where the two have moved in opposite directions.
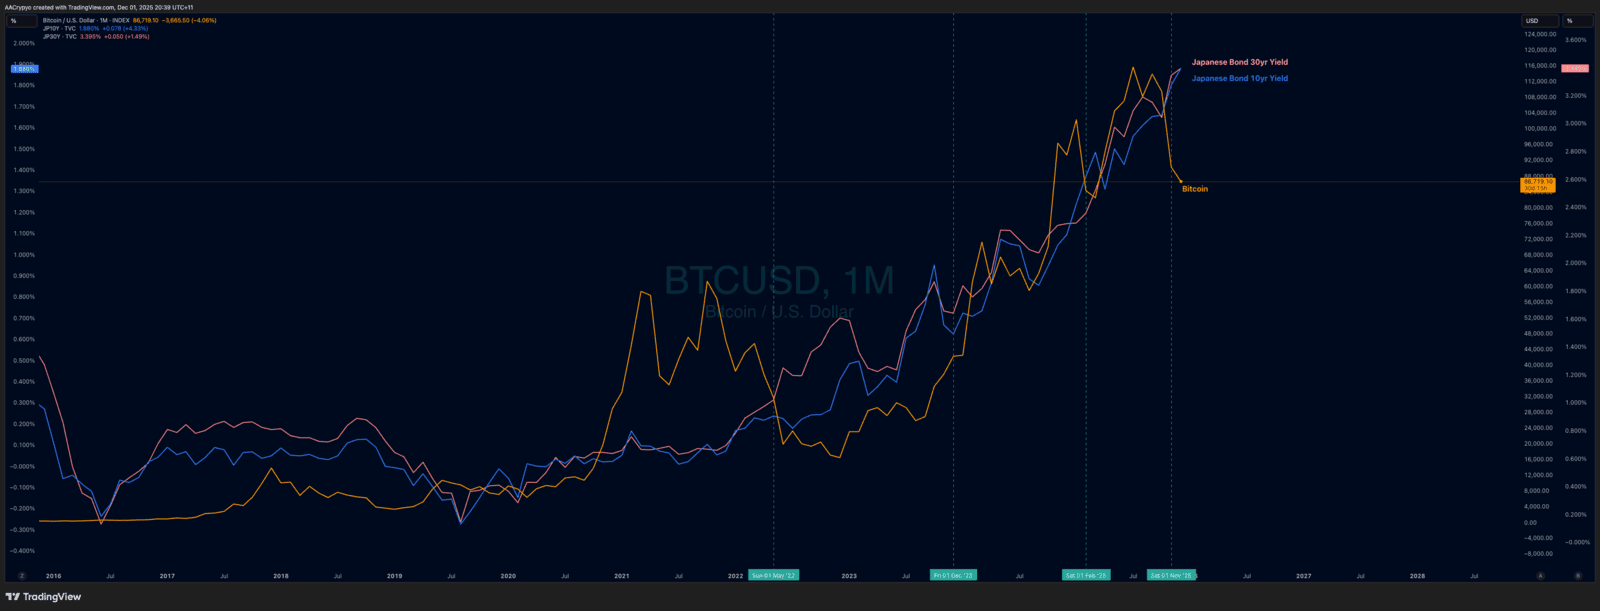
Since 2020 there have been three clear instances where a sudden spike in Japanese bond yields was followed by a sharp drop in Bitcoin. These occurred in mid 2022, February 2025 and again in November. In each case, yields rose sharply and Bitcoin corrected. On the flip side, in late 2023, yields fell and Bitcoin continued climbing. These periods tend to last one or two months before both assets resume their broader uptrend.
But the more persistent and clearer inverse relationship is between BOJ interest rates and Bitcoin.
For most of Bitcoin’s existence, the Bank of Japan held rates at or below zero. But over the past year, that environment has changed. Bitcoin is now dealing with a completely new macro backdrop that investors have not had to consider before, rising Japanese interest rates.
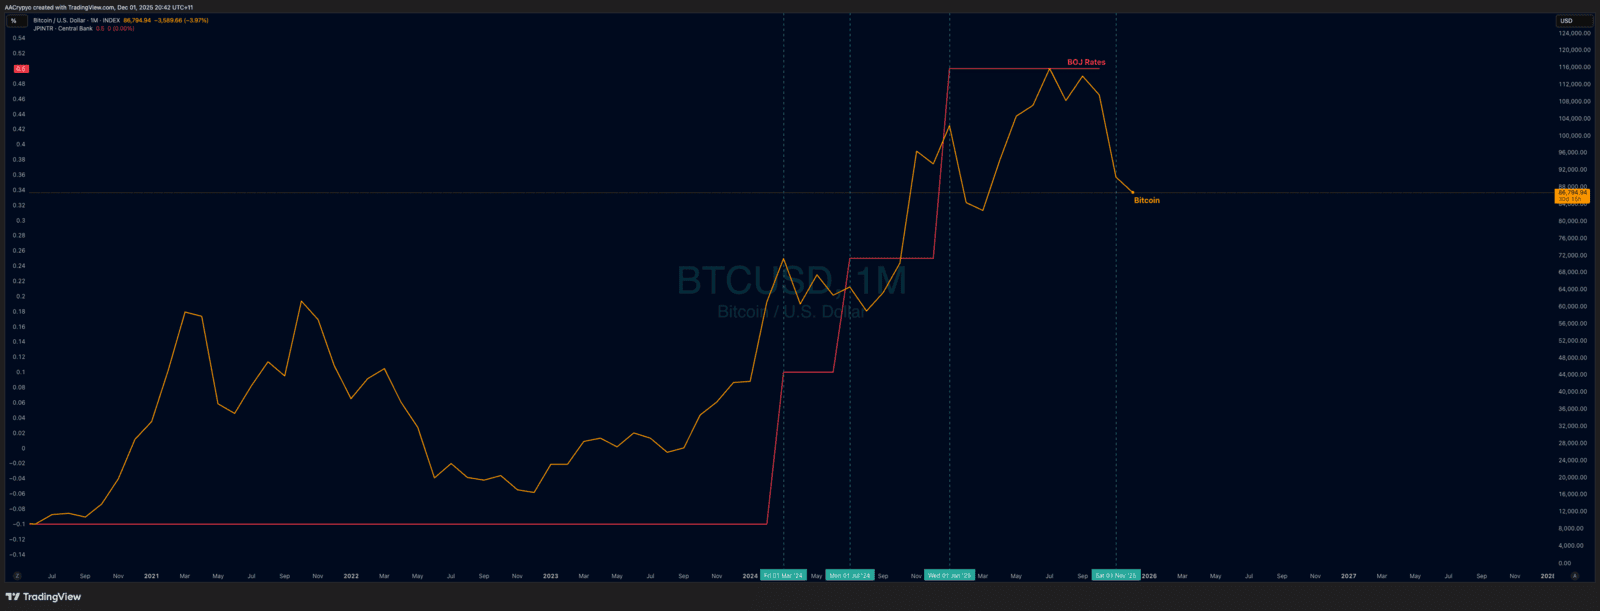
The chart above shows that every time the BOJ has raised rates, Bitcoin has entered a period of weakness. This is largely due to the cost of borrowing yen increasing. As that cost rises, the yen carry trade begins to unwind and large institutional investors are forced to sell risk assets like Bitcoin to close their positions.
We are now approaching another critical moment. The BOJ’s December rate decision is still uncertain, with odds sitting close to a coin toss. The key question is whether the correlation holds. If the BOJ hikes again and the relationship remains intact, Bitcoin may face renewed selling pressure.
While it might not be obvious at first, Bitcoin is heavily tied to Japanese policy. The BOJ plays a huge role in global markets through its position as the world's primary supplier of cheap credit. What happens in Tokyo does not stay in Tokyo, and Bitcoin is one of the first assets to feel it.
Written by Alexandar Artis
Start Your Brokerage Account
If you enjoyed this Rake Review, feel free to open an account and gain access to more proprietary research and work with your very own dedicated crypto broker.
No Advice Warning
The information in this newsletter is general only. It should not be taken as constituting professional advice from the author - Stormrake PTY LTD.
Stormrake is not a financial adviser and does not provide financial product advice. You should consider seeking independent legal, financial, taxation or other advice to check how the information relates to your unique circumstances. Stormrake is not liable for any loss caused, whether due to negligence or otherwise arising from the use of, or reliance on, the information provided directly or indirectly, by this newsletter.
Disclaimer
All statements made in this newsletter are made in good faith and we believe they are accurate and reliable. Stormrake does not give any warranty as to the accuracy, reliability or completeness of information that is contained here, except insofar as any liability under statute cannot be excluded. Stormrake, its directors, employees and their representatives do not accept any liability for any error or omission in this newsletter or for any resulting loss or damage suffered by the recipient or any other person. Unless otherwise specified, copyright of information provided in this newsletter is owned by Stormrake. You may not alter or modify this information in any way, including the removal of this copyright notice.Copyright © 2022 Stormrake Pty Ltd, All rights reserved

